A Sliding Share Price Has Us Looking At PrimeEnergy Resources Corporation's (NASDAQ:PNRG) P/E Ratio

To the annoyance of some shareholders, PrimeEnergy Resources (NASDAQ:PNRG) shares are down a considerable 48% in the last month. Indeed the recent decline has arguably caused some bitterness for shareholders who have held through the 60% drop over twelve months.
Assuming nothing else has changed, a lower share price makes a stock more attractive to potential buyers. In the long term, share prices tend to follow earnings per share, but in the short term prices bounce around in response to short term factors (which are not always obvious). So, on certain occasions, long term focussed investors try to take advantage of pessimistic expectations to buy shares at a better price. One way to gauge market expectations of a stock is to look at its Price to Earnings Ratio (PE Ratio). Investors have optimistic expectations of companies with higher P/E ratios, compared to companies with lower P/E ratios.
See our latest analysis for PrimeEnergy Resources
How Does PrimeEnergy Resources's P/E Ratio Compare To Its Peers?
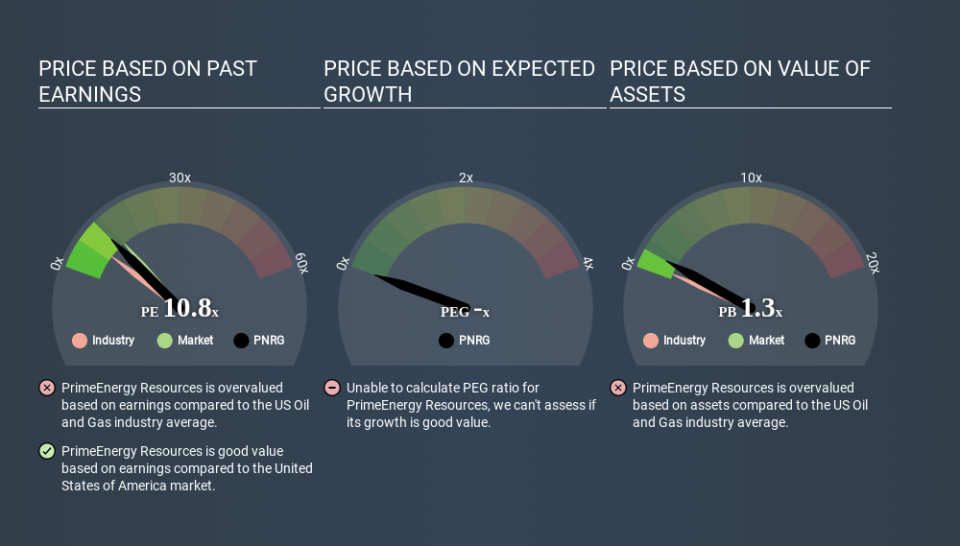
We can tell from its P/E ratio of 10.81 that there is some investor optimism about PrimeEnergy Resources. The image below shows that PrimeEnergy Resources has a higher P/E than the average (7.3) P/E for companies in the oil and gas industry.
Its relatively high P/E ratio indicates that PrimeEnergy Resources shareholders think it will perform better than other companies in its industry classification. The market is optimistic about the future, but that doesn't guarantee future growth. So investors should always consider the P/E ratio alongside other factors, such as whether company directors have been buying shares.
How Growth Rates Impact P/E Ratios
P/E ratios primarily reflect market expectations around earnings growth rates. That's because companies that grow earnings per share quickly will rapidly increase the 'E' in the equation. That means even if the current P/E is high, it will reduce over time if the share price stays flat. A lower P/E should indicate the stock is cheap relative to others -- and that may attract buyers.
PrimeEnergy Resources's earnings per share fell by 53% in the last twelve months. And over the longer term (5 years) earnings per share have decreased 4.3% annually. This growth rate might warrant a below average P/E ratio.
A Limitation: P/E Ratios Ignore Debt and Cash In The Bank
One drawback of using a P/E ratio is that it considers market capitalization, but not the balance sheet. In other words, it does not consider any debt or cash that the company may have on the balance sheet. In theory, a company can lower its future P/E ratio by using cash or debt to invest in growth.
Such expenditure might be good or bad, in the long term, but the point here is that the balance sheet is not reflected by this ratio.
So What Does PrimeEnergy Resources's Balance Sheet Tell Us?
PrimeEnergy Resources has net debt equal to 42% of its market cap. While that's enough to warrant consideration, it doesn't really concern us.
The Bottom Line On PrimeEnergy Resources's P/E Ratio
PrimeEnergy Resources trades on a P/E ratio of 10.8, which is below the US market average of 13.4. Since it only carries a modest debt load, it's likely the low expectations implied by the P/E ratio arise from the lack of recent earnings growth. What can be absolutely certain is that the market has become significantly less optimistic about PrimeEnergy Resources over the last month, with the P/E ratio falling from 20.7 back then to 10.8 today. For those who prefer to invest with the flow of momentum, that might be a bad sign, but for a contrarian, it may signal opportunity.
Investors should be looking to buy stocks that the market is wrong about. If it is underestimating a company, investors can make money by buying and holding the shares until the market corrects itself. Although we don't have analyst forecasts you could get a better understanding of its growth by checking out this more detailed historical graph of earnings, revenue and cash flow.
Of course you might be able to find a better stock than PrimeEnergy Resources. So you may wish to see this free collection of other companies that have grown earnings strongly.
If you spot an error that warrants correction, please contact the editor at editorial-team@simplywallst.com. This article by Simply Wall St is general in nature. It does not constitute a recommendation to buy or sell any stock, and does not take account of your objectives, or your financial situation. Simply Wall St has no position in the stocks mentioned.
We aim to bring you long-term focused research analysis driven by fundamental data. Note that our analysis may not factor in the latest price-sensitive company announcements or qualitative material. Thank you for reading.

