10 Degrees: Why WAR doesn't always add up

Do not consider the following a declaration of war on WAR as much as an invitation for its greatest adherents in the sabermetric community to practice what they preached to the mainstream media during baseball's analytical revolution: Please do better.
In recent months, the leaderboards for the Wins Above Replacement metric at FanGraphs and Baseball-Reference.com found themselves increasingly littered with players whose greatest value comes from their glove. Cognitive dissonance resulted, because as wonderful as analytics have been to baseball – as much as they've imbued us with a greater appreciation and knowledge of the game – defensive metrics, in their current form, are entirely incomplete.
And so WAR, the all-encompassing number that is supposed to allow us to compare ballplayers across generations, remains a great-in-theory idea whose kinks warrant if not a full reconsideration than at very least a healthy dose of skepticism.
Let's be clear on what WAR is: a product. WAR grew out of the idea to compare players to "replacement-level" – i.e., those at Triple-A – and estimate how many victories an individual's contribution during any particular season is worth. It's the conduit through which FanGraphs built its brand, and considering the excellent work done there on a daily basis, their analysis is well worth consuming. At the same time, sabermetrics grew out of a willingness to challenge preconceptions rooted in bias – and seeing as how WAR has turned into the standard bearer for the community, the metric of choice for analysis of who's better than whom, the near-wholesale acceptance of it makes them guilty of the very thing for which they long crucified the mainstream. When a brand relies on the veracity of a product, and the most vigorous defenses of said product come from those producing it, the air of dogmatism is pervasive.
Now, the current WAR calculations could very well prove accurate once a flood of defensive data arrives with the Statcast system expected to further revolutionize the game. For now, there is the reality that a metric is only as good as its weakest part, and the defensive components of WAR do not measure up to their offensive, or even baserunning, counterparts.
They are eons better than they used to be, of course, and whereas fielding used to be widely ignored save for the elite at high-profile positions, the idea that a run saved is as good as a run plated is a positive step. The problem with WAR is that in a universe where runs aren't actually runs but fractions of runs based on a theoretical model that assigns value to every conceivable situation, the defensive end demands data that covers every aspect of fielding.
Currently, that does not exist. In FanGraphs' version of WAR, a home run-robbing catch with two outs in the ninth inning of a one-run game counts the exact same as a catch 5 feet in front of the fence in the fifth inning of a game in which the outfielder's team trails 11-0. Take the game state out of the equation, and the difference is still stark. Not having wholesale data – where a fielder started, where he went, how fast he did so – caused those who calculate defensive metrics to compromise. They essentially grouped plays made in areas, without any context as to whether a player was helped or hurt by his positioning.
There are other qualms. Neither the UZR (Ultimate Zone Rating) metric FanGraphs uses nor the DRS (Defensive Runs Saved) metric from data aggregator Baseball Info Solutions calculates count plays with shifts for individual players, which, with thousands of shifts annually, drops a massive number of plays that actually happened. Both metrics expect to change this, but for now, it casts aspersions on the validity of the current numbers.
Questionable, too, is how a pair of metrics considering the exact same plays can so often come to such different conclusions. With 10 "runs" considered a "win" – each of which are supposed to be worth somewhere in the $6 million range – and a player like Adam Eaton a +12 in DRS and -2.4 in UZR, that disagreement covers nearly $10 million in value.
Perhaps the most difficult part to reconcile is how defensive metrics take the subjective and present it as objective. In lieu of a widespread camera-and-radar-tracking system, BIS uses video scouts who watch games, plot batted-ball locations and manually time a ball in the air to estimate how hard it was hit.
"We take as much of the subjectivity out of the process as we possibly can," said Ben Jedlovec, a vice president at BIS. "What we ask the video scout to do is not ask who made the play. We ask them to plot where it landed and time how long it was in the air. There's some room for error, but when you're plotting where the ball landed, you can get pretty good at plotting hit location. Timing something is a matter of a stopwatch or technology with the computer to count frames."
BIS tries to differentiate DRS by adding small flourishes. For example, it counts all home run robberies as +1.6 runs. It adds a component called Good Plays/Misplays that give added bonuses for web gems and subtracts for egregious screw-ups. It's the company's admission that, yes, the data isn't perfect, and that they're doing everything they can to move in that direction.
And that's often the retort to criticism of defensive metrics: Baseball is better with a single number for value than without one, and a single number for value is better with defensive numbers than acting like they don't exist. Here's the problem with that point: The aim of the sabermetric movement – enlighten the public as to what the game truly is about – has worked. Fielding is recognized as vital. While it would be wonderful to be able to objectively measure who's the best, even those who calculate the defensive metrics say one-year numbers are too small a sample for a true accounting of a player's value.
Even if defensive metrics' conclusions don't necessarily match up with the significance assigned to them, much appreciation is due those who have tried to popularize them, because otherwise we might not realize what a brilliant player …
1. Alex Gordon has become. This little exegesis all started with an innocuous tweet about Gordon.
Love Alex Gordon as a player. A legitimate star. The idea that he's the best player in baseball this year is absurd: http://t.co/Q6Vx9l2L00
— Jeff Passan (@JeffPassan) August 18, 2014
That led to a post on FanGraphs from Dave Cameron, which evolved into this Twitter back-and-forth, which will likely continue on a podcast-to-be-named-later. In which we'll discuss an interesting sidebar from FanGraphs' Jeff Zimmerman on how Gordon derives a significant amount of his value not just from his defense – which by scouts' accounts as well as metrics is indeed excellent – but from the poor defense of his left-field peers.
As Zimmerman wrote, Gordon is having what amounts to an average season for him, according to the available data, but is more than a win better because those at his position aren't very good. Certainly being better than your contemporaries at something is very valuable; similarly, a 40-home run season in 2014 is worth far more than one in 1998.
Still, defense almost alone places Gordon behind only Mike Trout among position players in fWAR (FanGraphs' version of WAR) and boosts him to a tie for sixth in rWAR (Baseball-Reference's) despite an OPS more than 100 points lower than Trout's (and 150-plus points lower than Giancarlo Stanton's). It's the same reason …
2. Jason Heyward is Baseball-Reference's fourth-highest-valued player despite an average that ranks 77th of the 153 players who qualify for the batting title, an on-base percentage that's 33rd and a slugging percentage 97th. Josh Donaldson, he of the .253/.343/.457 line, is considered the best everyday player in baseball this year by rWAR. In 1996, the average American League hitter slashed .277/.350/.445.
Like Gordon, Heyward benefits significantly from playing a position riddled with the detritus of center-field dreams. And that's a fair point of criticism against defensive metrics. For his career – albeit a minute 182-inning sample – Heyward is rated a negative defensive center fielder. Should he get rewarded for ostensibly mastering an easier-to-play position? Because the likelihood is strong that someone like Jacoby Ellsbury – a wonderfully rangy center fielder whose arm could be buried in left field – would turn into an elite corner guy rather than a barely-above-average value at his position.
As it is, Heyward leads the major leagues this season in both UZR and DRS. Right behind him is …
3. Juan Lagares, perhaps the greatest test of defensive metrics there is.
The 25-year-old Lagares is the New York Mets' center fielder. Like Gordon and Heyward, he is regarded as an excellent defender by scouts. The metrics tend to agree on this, which makes it fair to believe that, yes, Lagares is very good at catching and throwing baseballs.
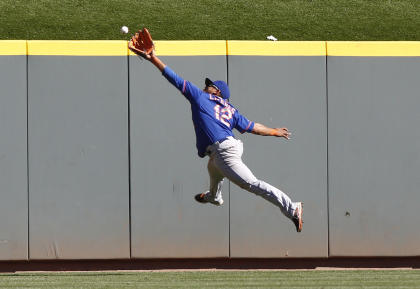
One chunk of data regarding Lagares proved interesting. FanGraphs publishes data from a company called Inside Edge that provides scouting reports on players. It separates fielding data into six buckets: plays made 0 percent of the time, 1-10 percent, 10-40 percent, 40-60 percent, 60-90 percent and 90-100 percent. Calculating where such a play falls necessitates a human entering in data and an algorithm parsing it.
On the 0 percent plays, Lagares is 0 for 32 this year. On the 1-10 percent, he is 0 for 15. Across the major leagues this season, center fielders have made 24 such plays. Billy Hamilton leads with three. On 10-40, Lagares is 3 for 7 – Hamilton and Ellsbury both went 4 for 7 – and on 40-60 he is 2 for 3, with Ben Revere 9 for 9. Lagares was a perfect 7 for 7 from 60-90 (Trout was 14 for 14 and Revere 13 for 13) and the same from 90-100, on 254 chances, the second-fewest of the seven players flawless on the easy ones.
Once again: This is not to say Lagares isn't great. That just doesn't read like the profile of someone who has saved 23 runs with his glove alone, as DRS claims. Nor does it sound like the sort of player who can bat .282/.322/.384 and still find himself with 5.6 rWAR or 3.9 fWAR. (Don't worry. We'll get to the disparity between the two later.)
One of the vital things to understand, since WAR and …
4. Mike Trout become synonymous over the last two seasons with people who wanted a good strawman to advocate for Miguel Cabrera, is that many of the issues above do not apply to him. What do are the principles espoused by WAR: that fielding matters and that position does, too.
It's why Trout deserved the MVP the past two years – yes, that sound you hear is a broken record – and why he's the heavy favorite this year. While both UZR and DRS say his fielding this season has been poor, scouts say only that his arm is a weakness, and his range remains elite. This could be bias on their part. It could be accurate. He could be a victim of bad positioning by coaches. He could be regressing, too, like the metrics say.
Whatever the case, he still leads in fWAR and ranks second in rWAR, though the numbers are close enough that the creators of WAR admit a potential margin of error up to one win exists. It's a good thing Trout does play such an important position and run the bases so well, because otherwise …
5. Victor Martinez would be breathing down his neck for AL MVP. Martinez's .334 batting average is the second best in the major leagues. So is his .573 slugging percentage. And as difficult as it may be to believe, Martinez is the only player in baseball with an on-base percentage above .400.
For that, Martinez ranks 34th in fWAR and 23rd in rWAR. Both numbers penalize him for subpar defense in his short stints at first base this season as well as the shortcoming of spending most of his days as a designated hitter. WAR uses positional adjustments to tamp down the numbers for those who contribute less on defense (DHs, first basemen and corner outfielders receive negative runs for their positions) and bump up those at skill positions (center fielders, third basemen, second basemen, shortstops and, most of all, catchers).
Even though he's been arguably the best hitter in the major leagues – the only others close are Jose Abreu and Giancarlo Stanton – Martinez loses close to two wins in FanGraphs on account of his defense. Maybe this is fair. In a defense-heavy environment, where offense is at a premium, a performer of Martinez's caliber would seem to deserve better. Particularly when …
6. Steve Pearce is tied with him in rWAR and two-tenths of a win behind him in fWAR.
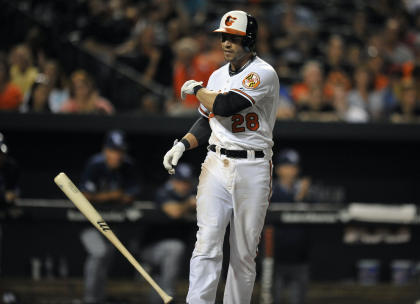
For those who have not heard of Pearce, he is a 31-year-old outfielder with a career-high 318 plate appearances this season. His batting average, on-base percentage and slugging percentage all are about 50 points lower than Martinez's. He's got about half the home runs Martinez does. Pearce has been a really good platoon player, destroying left-handed pitching at nearly a 1.050 OPS clip.
He has not been Victor Martinez. He has not been anything close to Victor Martinez. Nor has he been Adam Jones, Pearce's teammate in Baltimore and one of the best center fielders in the game. Jones' rWAR is 4.1 – a half-win fewer than Pearce's.
It's issues like that, and like Eaton having 4.8 rWAR (because of his +12 DRS) and 2.5 fWAR (on account of -2.8 UZR), that turn people off to WAR. Every metric will have its issues, of course, and …
7. Johnny Cueto shows the disparity isn't just limited to hitters. The interpretation of pitchers differentiates fWAR and rWAR to perhaps a greater degree than the hitters, and Cueto is perhaps the best example this year.
FanGraphs uses Fielding Independent Pitching to calculate its pitching WAR. FIP takes the three outcomes that involve no fielders – strikeouts, walks and home runs – and judges a pitcher on them. Baseball-Reference works off the number of runs a pitcher allows. In most cases, a Baseball-Reference explainer says, they "will be very close and are strongly correlated, but there are a number of cases each year where there are large disparities between the two metrics."
Cueto is the 13th-best pitcher in baseball by FanGraphs' count, with 3.6 WAR. Baseball-Reference says he's the fourth-best, at 5.8 WAR, which dovetails more with standard thought. Hurting Cueto in fWAR is mostly his home run rate – .84 per nine innings – and the apparent disregard of its calculation for innings pitched. Despite throwing only two-thirds the innings of Cueto, Yu Darvish has more than half a win than Cueto, according to fWAR. Also ahead of him is …
8. Jose Quintana, whom rWAR actually rates behind three relief pitchers (Wade Davis, Dellin Betances and Jake McGee). FanGraphs has Quintana as the ninth-most-valuable pitcher this season, again mostly because of his home run rate, which may well be a fluke.
While he is pitching more down in the zone this year – about a quarter of Quintana's pitches have crossed the plate below the strike zone this year, compared to around one-fifth last year – his groundball rate has ticked up negligibly. It's not exactly the sort of profile that leads to a massive change in home runs hit. Sometimes it's best to chalk that up to luck, especially when his home run rate was more than double this season's in Quintana's first two years.
Certainly rWAR has its pitching kinks, too, as …
9. Madison Bumgarner finds himself with 3.2 wins to Jason Vargas' 3.6. The tale of the tape:
• Bumgarner has thrown 28 more innings
• Bumgarner has a much better strikeout rate (9.09 to 5.96)
• Bumgarner has a better ERA (3.02 to 3.14)
• Bumgarner has a slightly better walk rate (1.78 to 1.81)
• Vargas has a slightly better home run rate (.80 to .82)
• Bumgarner has a lower opponents batting average, on-base percentage and slugging percentage
So why is Vargas higher? Baseball-Reference park-adjusts its pitching WAR, and because AT&T Park is considered such a strong stadium for pitchers, Bumgarner is dinged there. Moreover, Bumgarner pitches in the National League, where fewer runs are scored, and so Vargas' combination of home ballpark (the neutral-rated Kauffman Stadium … which most in the game consider a distinct pitcher's park) and league (American) give him more value. FanGraphs has Bumgarner nearly a win ahead of Vargas, who owes much of his strong ERA this year to …
10. Alex Gordon and the rest of the incredible Kansas City defense. It's why a week into September, the Royals remain in first place. All around the diamond, and especially in an outfield with Gordon, Jarrod Dyson and Lorenzo Cain, the Royals are saving runs with incredible catches and brilliant throws.
Putting a true number on their contributions would be wonderful. We're just not there yet. Not when Cameron himself, in a recent chat, said WAR's margin of error is "maybe pushing towards two in the case of an extreme defensive rating."
Though such cases are rare, they are instructive. Because they encompass Lagares and Heyward and, yes, Gordon. And as much as Cameron has warned that "we don't encourage you to use any version of WAR as the be-all, end-all of analysis," FanGraphs sorts both its pitching and hitting leaderboards by WAR. When Cameron writes his annual trade value column, he uses projected WAR. It's not the be-all, end-all, but FanGraphs subtly suggests its readers use it as such.
During our Twitter back-and-forth, Cameron asked for a solution. The clear one seems to be wait for better data until weighing fielding numbers equally with batting ones, but WAR doesn't exist that way, and it's not going away. Another suggestion was to regress the numbers, both individually within a particular season and over multiple years by position, so that the plus defenders are rewarded but not with the sort of confidence currently placed in the defensive metrics.
That idea dovetailed with one from Sean Smith. Three years ago, I reached out to Smith for a story I planned on writing about WAR. He created rWAR and has grappled with the handling of defense for years.
"You need to use something for player defense," Smith wrote in an email. "Everybody knows that Andrelton Simmons is better at shortstop than some guy playing out of position there due to team needs, who would be a better fit at third base. You don't have to trust any specific defensive metric out there. You can use the idea of WAR without them. Rate the players by yourself and turn them into runs – +10 for above average, zero for average, -10 for below. Make up your own scale, just be consistent.
"The important thing is you have to use something to evaluate defense. Refusing to do so is to assume all defenders are average. This is just as wrong on the defensive side as assuming Andrew Romine is an equal hitter to Miguel Cabrera."
Smith is right. Defense does have its place in WAR. Just not in its present incarnation, not until we know more. Not until we can account for positioning on the field. Not until we can find out the exact speed a ball leaves a bat and how quickly the fielder gets a jump and the angle on the ball and the efficiency with which he reaches it. Not until we understand more about fielding, which will allow us to understand how to properly mete out value on a defensive play, which may take years, yes, but look how long it took us to get to this point, where we know more about hitting and pitching than anyone ever thought possible.
The hackneyed Luddites who bleat "WAR, what is it good for, absolutely nothing" should not see this as a sympathetic view. On the contrary, WAR is an incredible idea, an effort to democratize arguments over who was best. Bringing any form of objectivity to such singularly subjective statements is extremely challenging and worthwhile work.
Which is why this at very least warrants more of a conversation among those who are in charge of it. They've changed WAR formulas before. They'll change them again. And when they do, hopefully the reach of defensive metrics will be minimized. For years, Bill James and his disciples taught everyone in the baseball community not to speak of what they don't know.
We don't know how to judge defense to the sort of standard WAR merits. Soon enough, maybe. Just not yet.
More MLB coverage:
