By the Numbers: No. 13 Oklahoma Sooners vs. TCU Horned Frogs

The Oklahoma Sooners vs. the TCU Horned Frogs may look like a mismatch based on their records coming into the game. However, the TCU Horned Frogs are a bit reminiscent of the Sooners from 2022, who struggled in one-score games.
TCU was really good in one-score games a year ago, but haven’t been as fortunate this season. They’re a young team that has had some growing pains. In particular, they’ve gone as redshirt freshman Josh Hoover has gone. When he’s protected the football, the Horned Frogs have been hard to beat.
The same can be said for the Sooners. In their two losses, Oklahoma turned the ball over six times. In their other nine games, the Sooners turned the ball over just six times.
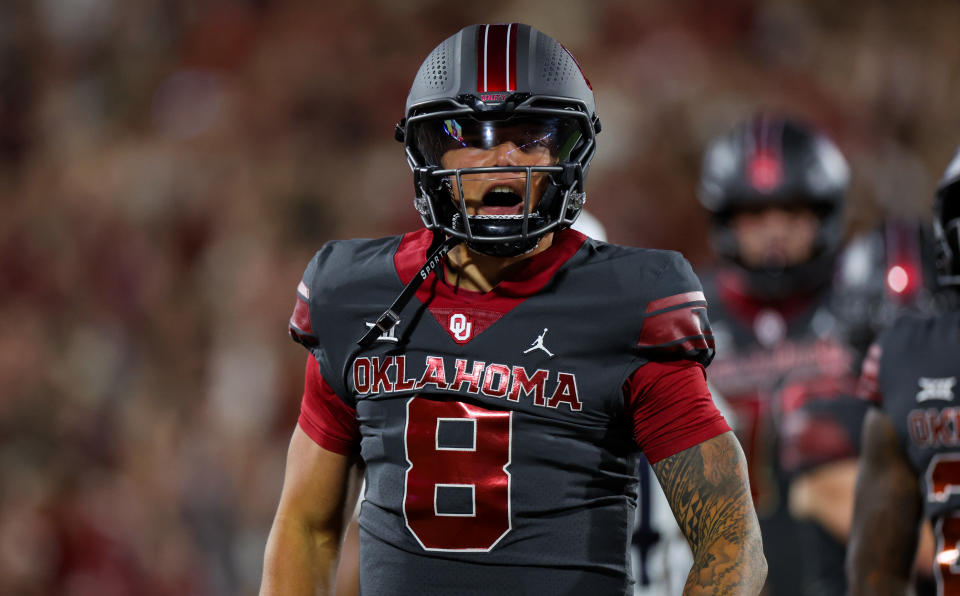
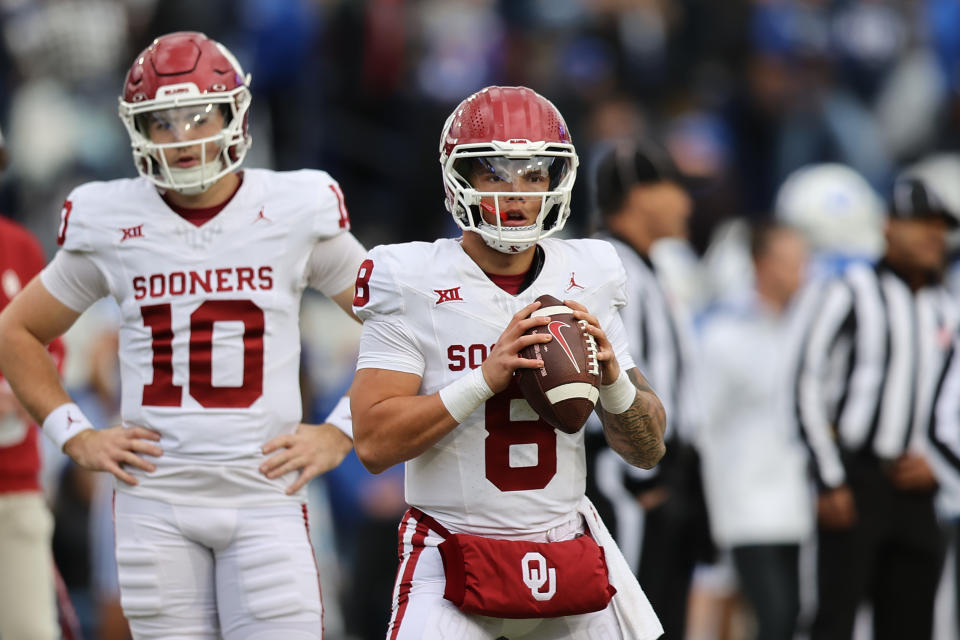
The other big storyline in this game is the health of Dillon Gabriel. Brent Venables said earlier in the week that he expects Gabriel to be available. But if he’s not, Jackson Arnold will get the first start of his career. We’ve seen some good things from the true freshman former five-star quarterback. But how will he respond to his first start on a short week?
This game has a chance to be a weird one given the early kickoff and coming on Black Friday. Will the home Sooners show up? Will they stay explosive in the passing game even if it is Jackson Arnold at the helm?
Here’s a statistical look at the two sides for this Black Friday affair in this week’s By the Numbers.
Total Offense
Oklahoma: 7th (492.9 yards per game)
TCU: 14th (461.8 yards per game)
Edge: PUSH
Passing Offense
Oklahoma: 7th (314.7 yards per game)
Completion Percentage: 7th (70.3%)
TCU: 9th (309.3 yards per game)
Completion Percentage: 32nd (64.5%)
Edge: PUSH
Rushing Offense

Oklahoma: 39th (178.2 yards per game, 4.4 yards per carry)
TCU: 75th (152.5 yards per game, 4.5 yards per carry)
Edge: Oklahoma
Scoring Offense
Oklahoma: 4th (40.8 points per game)
TCU: 48th (30.1 ppg)
Edge: Oklahoma
PFF Offense Rank

Oklahoma | TCU | |
Offense | 22 | 35 |
Passing | 8 | 54 |
Pass Blocking | 52 | 58 |
Receiving | 7 | 19 |
Rushing | 42 | 35 |
Run Blocking | 89 | 92 |
Edge: Oklahoma
Total Defense
Oklahoma: 66th (378 yards per game, 5.3 yards per play)
TCU: 88th ((390.3 yards per game, 5.4 yards per play)
Edge: Oklahoma
Pass Defense
Oklahoma: 77th (232.9 yards per game)
Completion Percentage Allowed: 16th (56.3%)
TCU: 97th (240.4 yards per game)
Completion Percentage Allowed: 50th (59.4%)
Edge: PUSH
Run Defense

Oklahoma: 59th (145.1 yards per game)
Yards Per Carry Allowed: t-43rd (3.9 yards per carry)
TCU: 57th (149.1)
Yards Per Carry Allowed: t-43rd (3.9 yards per carry)
Edge: PUSH
Scoring Defense
Oklahoma: 30th (20.2 ppg)
TCU: 55th (24.1 ppg)
Edge: Oklahoma
PFF Defense Rank
Oklahoma | TCU | |
Defense | 41 | 68 |
Run Defense | 33 | 38 |
Tackling | 48 | 81 |
Pass Rush | 67 | 120 |
Coverage | 51 | 81 |
Edge: Oklahoma
Sacks Per Game
Oklahoma: t-105th (1.64)
TCU: t-61st (2.09)
Edge: TCU
Sacks Allowed Per Game
Oklahoma: t-21st (1.27 per game)
TCU: t-41st (1.64)
Edge: Oklahoma
Third Down Offense
Oklahoma: 11th (48.6%)
TCU: 17th (46.9%)
Edge: PUSH
Third Down Defense
Oklahoma: 10th (29.3%)
TCU: 56th (38.8%)
Edge: Oklahoma
Turnover Differential Per Game
Oklahoma: +1.09 (3rd)
TCU: -0.73 (t-120th)
Edge: Oklahoma
Red Zone Offense

Oklahoma: 43rd (87.5%)
TCU: 127th (68.9%)
Edge: Oklahoma
Red Zone Defense
Oklahoma: t-22nd (75.8%)
TCU: t-73rd (83.8%)
Edge: Oklahoma
Contact/Follow us @SoonersWire on Twitter, and like our page on Facebook to follow ongoing coverage of Oklahoma news, notes, and opinions. You can also follow John on Twitter @john9williams.

