This unexpected edge could be difference-maker for Cowboys vs. Bucs

The Dallas Cowboys started their 2022 season with a 19-3 defeat to the Tampa Bay Buccaneers, losing quarterback Dak Prescott, safety Jayron Kearse and left guard Connor McGovern in the process. All three would return and help the Cowboys finish with a 12-5 record, their first 12-win seasons in consecutive years since the 93-94 seasons.
As for the Bucs. they were unable to rekindle their success in the ground game and would suffer multiple injuries to their offensive line on their way to an 8-9 record.
Each week we open up the Advanced Stat Notebook to analyze how each team ranks in EPA, DVOA, ANY/A and Toxic Differential. These four key metrics have a high correlation to win probability.
Defense-Adjusted Value Over Average (DVOA) - Football Outsiders

(Photo by Tom Pennington/Getty Images)
DVOA is a metric which measures the success of each play as compared to league average using percentage points above or below average. The metric measures down, distance, field location, quarter and quality of opponent.
With DVOA, teams are looking for a higher percentage offensively and a lower percentage defensively. On offense and special teams, the objective is to perform above league average while defenses are looking to force their opponents to perform below league average.
Information via Football Outsiders.
DVOA Offense

The Bucs rank two spots higher than the Cowboys in passing with a DVOA of 17.9%, 11th overall.
While passing DVOA was relatively close, things get a bit ugly for the Tampa Bay offense in rushing. Thier ground game ranks 30th with a DVOA of -18.6%. The Cowboys rank 20 spots higher with a 1.2% DVOA. Major advantage for the Cowboys.
Overall offensive DVOA is extremely close with the two teams finishing one spot apart with a difference of just 2.5% between them. The Cowboys rank 15th with a DVOA of 2.9% while the Bucs rank 16th.
Offensive Advantage: Cowboys (2 of 3)
DVOA Defense

Defensive passing DVOA favors the Cowboys by a large margin. The Cowboys rank third overall with a DVOA of -11.3% while the Bucs rank 15th allowing a positive 2.7%.
Both teams have held opponents running games to negative DVOA’s. The Cowboys rank fifth overall with a -15.7% DVOA, eight spots higher than the Bucs’ -10.4% DVOA.
The edge in overall defensive DVOA goes to the Cowboys who rank second with a DVOA of-13.3%. The Bucs rank 11 spots below at -2.9%.
Defensive Advantage: Cowboys (3 of 3)
Overall Advantage: Cowboys (5 of 6)
Expected Points Added and Success Rate

(AP Photo/Michael Ainsworth)
EPA measures the impact a play has on the likelihood of scoring. With EPA, yardage, field position, and down and distance all weigh in on what the expected net points would be for the situation. As an example, a first and goal at the one-yard line would represent a higher EP-Expected Points than a third and 10 on your own 20 yard line.
EPA is the difference between the Expected Points (EP) at the beginning of the play compared to the end of the play. It measures the plays impact on the score of the game.
Success rate is a measure of how often teams get 40% of the needed yards on 1st down, 60% on 2nd down and 100% on third down or fourth down.
EPA figures gathered by rbsdm.
EPA: Offense

The Cowboys rank 10 spots higher in EPA/play, averaging .031 points over expectation per snap. The Bucs offense has an EPA/play of -.031.
The Cowboys offense ranks ninth overall, five spots higher than the Bucs with a passing EPA per dropnack of .082.
The Cowboys run game ranks 12th in rushing EPA/play at -.031 per carry. The Bucs offense ranks 32nd in the league averaging -.208 EPA per carry.
Finishing the clean sweep, the Cowboys lead in success rate at 45.2%, seven spots higher than the Bucs.
Offensive Advantage: Cowboys
EPA: Defense

The Cowboys defense has ranked amongst the best units in the NFL this season and have held opponents to -.087 EPA per play, the second best rate in the league. The Bucs rank nine spots below with an EPA of -.025/play.
The Cowboys have the fourth best EPA/dropback, holding QB’s to -.059 EPA play. This is the key matchup that could determine the outcome of this playoff game as the Bucs have a potent passing attack.
Rushing EPA/play may come as a surprise but the Cowboys run defense ranks fourth in EPA allowed holding opponents to -.126/EPA per carry. The Bucs rank 12th with an EPA of -.084/carry.
Both teams rank in the top 10 in success rate but the advantage goes to the Cowboys who rank fourth with a success rate of 41.4%.
Defensive Advantage: Cowboys
Overall Advantage: Cowboys ( 8 of 8 EPA categories)
Toxic Differential: Toxicity

(Photo by Richard Rodriguez/Getty Images)
Toxic differential (also referred to as Toxicity) adds the number of explosive plays an offense generates and subtracts the number of explosive plays a defense allows, then adds the turnover margin.
Under Brian Billick’s formula, explosive plays are defined as passing plays over 20 yards and rushing plays over 10 yards.
Toxic Differential: Offense

The Cowboys offense produced 50 explosive passing plays this season, one more than the Bucs. The Cowboys averaged 2.94 passes over 20+ yards this season.
While passing was extremely close, the difference in explosive running plays is substantial. After starting the season out against the Cowboys with seven explosive runs, the Bucs were only able to produce 20 more the rest of the season. The Cowboys generated 62 runs over 10 yards this season.
Both offenses did a fairly good job of protecting the football. The Bucs had 22 giveaways this season, one less than the Cowboys.
Cowboys: 50 explosive passes+ 62 explosive runs= 112 explosive plays.
112 explosive plays – 23 turnovers= Offensive Toxicity score of 89.
Bucs: 49 explosive passes+ 27 explosive runs= 76 explosive plays.
76 explosive plays – 22 turnovers= Offensive Toxicity score of 54.
Offensive Advantage: Cowboys
Toxic Differential: Defense

The Bucs defense has done a great job of limiting explosive passing plays, allowing just 41 for the season, an average of 2.41/game.
The Cowboys struggled all season with explosive runs, allowing 67 on the year, 3.94/game. The Bucs defense also allowed several big runs but surrendered 12 less than the Cowboys.
The Cowboys has a huge advantage in takeaways, generating a league-leading 33 takeaways this season, 13 more than the Bucs.
Cowboys: 43 explosive passes+ 67 explosive runs= 110 explosive plays.
110 explosive plays – 33 takeaways= Defensive Toxicity score of 77.
Bucs:41 explosive passes+ 55 explosive runs= 96 explosive plays.
96 explosive plays –20 takeaways= Defensive Toxicity score of 76.
Defensive Advantage: Bucs
Overall Toxicity is determined by subtracting the defensive total from the offensive total.
Cowboys Toxicity: Offense 89 – Defense 77 = Overall Toxicity +12
Bucs Toxicity: Offense 54 – Defense 76= Overall Toxicity -22
Overall Advantage: Cowboys
ANY/A

(Photo by Tom Pennington/Getty Images)
Adjusted Net Yards Per Pass Attempt, or ANY/A, is a formula which incorporates passing yardage, touchdowns, sacks and interceptions into a per-throw average. ANY/A has a direct correlation to scoring points and as such ranks third in win predictability.
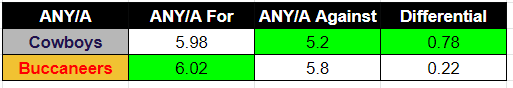
The Bucs have a slight advantage in ANY/A for with a difference of .04 yards per attempt between the two teams.
The edge in ANY/A against is larger, favoring the Cowboys by .60 yards per attempt.
The Cowboys lead in overall ANY/A differential at .078, .56 yards better per attempt.
Advantage: Cowboys
Overall Recap

(AP Photo/Mark LoMoglio)
Toxicity: Cowboys ( 4 out of 8 but lead in overall toxicity)
DVOA: Cowboys (5 out of 6)
EPA: Cowboys (8 out of 8)
ANY/A: Cowboys (2 out of 3)
Overall: Cowboys (lead 19 of 25 metrics)

