Squared-Up Rate: What is it and who stands out?
This second in a series of articles looking at the new bat speed data available on Baseball Savant focuses on Squared-Up Rate. Kind of. We’ve already covered Bat Speed in detail; Bat Speed shows us the potential for how hard one can hit a ball. Squared-Up Rate is about determining how much of that potential a swing unleashed. The bat speed at contact combined with the speed of the pitch at contact creates a maximum possible exit velocity for each swing. For a select few, that’s a bit more than 120 mph. For most, it’s closer to 110 mph. The actual exit velocity divided by that determined maximum provides the Squared-Up Rate. Hence, a 106-mph exit velocity on a 110-mph maximum would be a 96 percent Squared-Up rate. A pitch that’s popped up might have a 75-mph exit velocity on a 110-mph maximum, which would be a 68 percent Squared-Up Rate.
Related: Bat Speed Leaderboard
Pretty easy, right? How much of your swing’s potential did you convert? This is where I’d like to present a leaderboard of the players with the best average Squared-Up Rates in the league. However, that is not a thing. Instead of sticking with actual “Squared-Up Rate” in presenting data, Statcast is instead going with simply “Squared-Up.” That’s the percentage of how often a player manages at least an 80-percent Squared-Up Rate on contact. It’s really a bit confusing. An 80% Squared-Up ball on a swing with a 110-mph maximum would check in with an exit velocity of 88 mph. According to MLB, balls that were at least 80 percent squared up produced a .371 average and a .656 slugging during the early part of the season. Balls that weren’t squared up came in with a .126 average and a .142 slugging.
Listen to the Rotoworld Baseball Show for the latest player news, waiver claims, roster advice and more from our experts all season long. Click here or download it wherever you get your podcasts.
What this leaves is a Squared-Up percentage that tracks a lot like hard-hit rate. Much like how a 95-mph hit and a 115-mph hit count the same in hard-hit rate, Squared-Up percentage treats the good swings and the great swings the same. The frequency of hard-hit balls is a bit higher than Squared-Up percentage. Right now, the hard-hit rate across the league is 39%. The league Squared-Up percentage is at 32%.
So, the league Squared-Up percentage leaderboard is quite a mixed bag, since actual bat speed isn’t involved. It doesn’t matter how you’re getting there, just that you put the sweet spot on the ball.
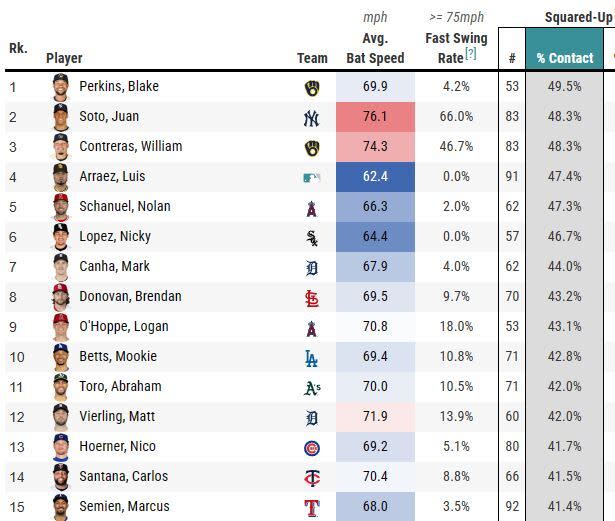
There you have it: Juan Soto, with his .314/.414/.541 line this season, on the same leaderboard as Nicky Lopez, who is batting .204/.277/.222. Soto has 17 extra-base hits this season. Lopez has two. Both are often hitting the ball how they want to hit it. But Soto is doing so with an average bat speed of 76.1 mph, while Lopez is doing so at 64.4 mph.
The obvious takeaway here is that you reach more of your contact potential with a slower swing, which just makes it astounding what Soto and Contreras are doing. 24 qualified hitters have Squared-Up percentages over 40%. Soto, Contreras and Shohei Ohtani are the only members of that group with an above average Bat Speed (though a surprising name, Detroit’s Matt Vierling, comes close with his 71.9-mph average Bat Speed and 42% Squared Up).
The bottom of this 216-player leaderboard:
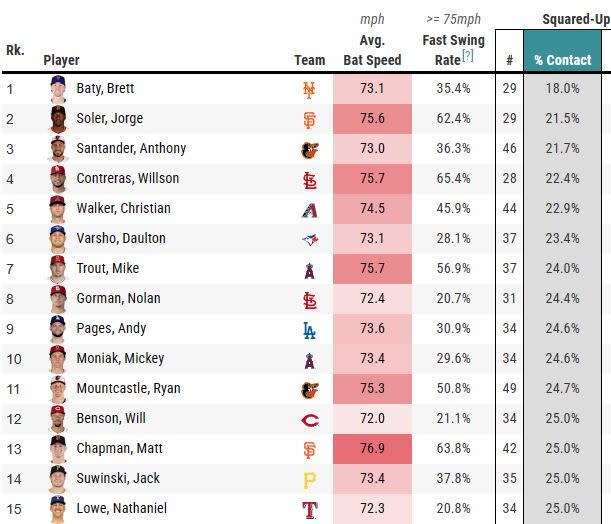
Another pretty interesting mixed bag. Everyone in the bottom 10 here has above average Bat Speed and above average swing length. Some have had great success this year. Some obviously haven’t. It’s disturbing just how low Baty is compared to everyone else; the Mets would have been justified in sending him down weeks ago.
The only two in the bottom 25 here below 72 mph with their average Bat Speed are Mike Tauchman (68.9 mph) and Jonathan India (70.7 mph). Tauchman is surprising, given that he’s been pretty successful despite not having much power. I assume it’s something of a fluke.
Here’s one last leaderboard: MLB’s batting average leaders to date and where they place on the 216-player Squared Up leaderboard.
Player | Batting Average | Squared-Up % | Rank |
.354 | 48.3 | 3 | |
Shohei Ohtani | .354 | 40.4 | 23 |
.353 | 39.4 | 28 | |
.343 | 37.7 | 44 | |
.341 | 42.8 | 10 | |
.338 | 38.6 | 33 | |
.333 | 40.6 | 20 | |
.333 | 34.6 | 82 | |
.322 | 37.6 | 48 | |
.320 | 33.7 | 94 |
This is where Squared Up percentage should match up best to results on the field, and there is something here. A great Squared-Up percentage isn’t necessarily going to produce good numbers and a bad one isn’t necessarily going to produce bad numbers, but you’re probably not going to hit for an exceptional average without squaring up fairly regularly.
My feeling here is that Squared-Up percentage just isn’t telling us enough. The folks behind Statcast are awfully smart and obviously had their reasons for setting the 80% threshold as Squared Up, but it seems to me that 85% might have been more illustrating. As is, Squared-Up balls are still outs nearly two-thirds of the time.
(Also, the whole naming convention is bad. Squared-Up Rate should be the name for the actual statistic they’re going by here, not the stat within the stat. I keep feeling like I have to write Squared-Up percentage for this Squared Up statistic, which is annoying.)
Squared Up does help demonstrate why a hitter with excellent Bat Speed is struggling or one with little Bat Speed is productive, putting a number to something we already could mostly figure out ourselves. It’s part of the puzzle, but not a corner piece, at least not the way Statcast has chosen to present it.
