By the Numbers: No. 7 Oklahoma Sooners vs. UCF Knights

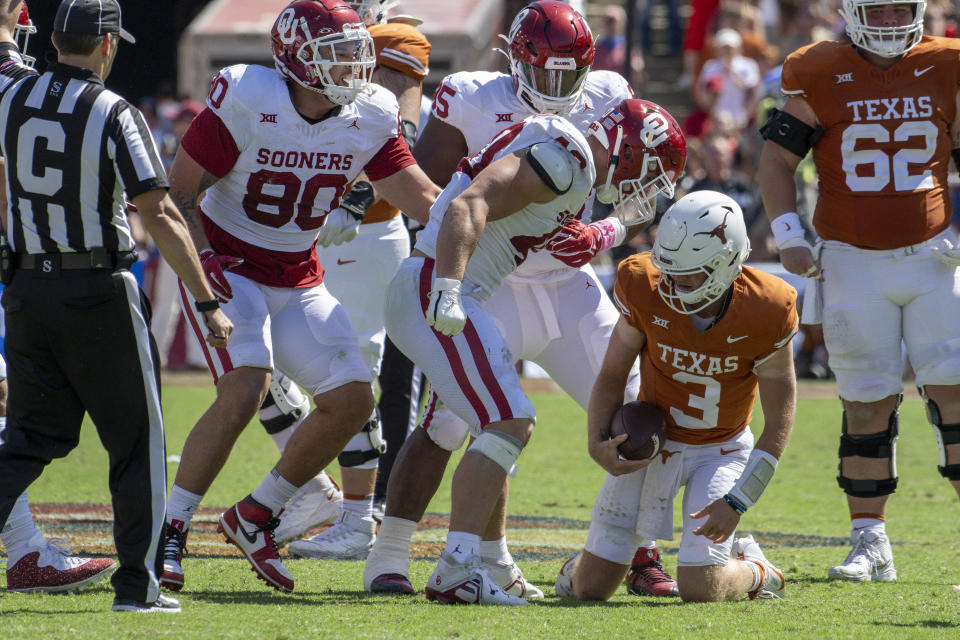
The Oklahoma Sooners were put to the test in their Red River Rivalry win over the Texas Longhorns. It was the first one-score game of the season for Brent Venables’ bunch after playing in a number of tight games last season.
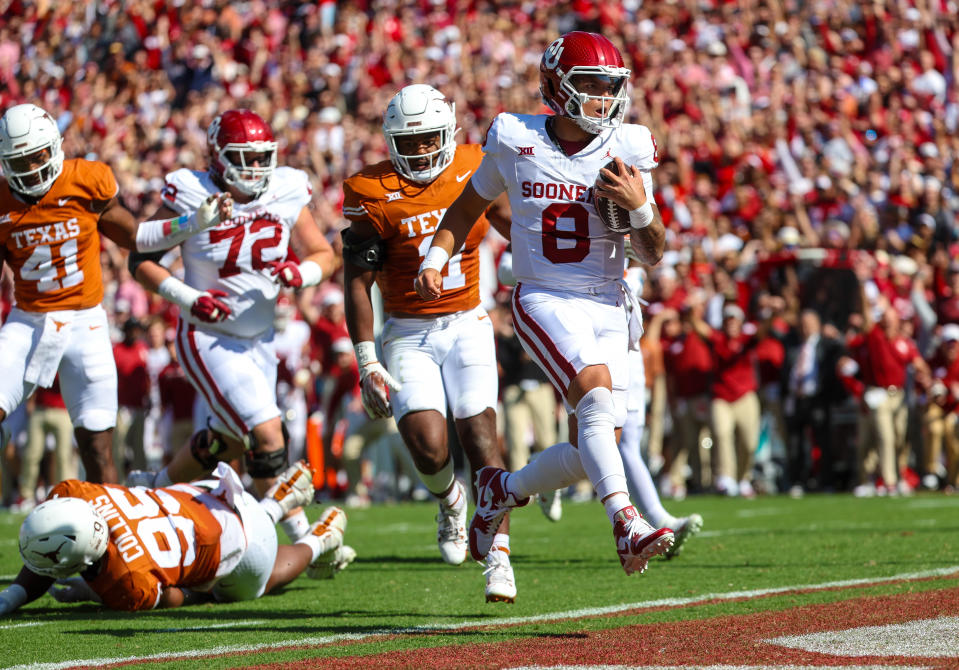
It could have gone either way at the end with the Sooners needing a last-minute drive to pull out the upset win over the Longhorns. Dillon Gabriel was masterful leading Oklahoma down the field in no time at all to get the go-ahead touchdown.
This week, against the UCF Knights, provides another challenge for the Sooners’ defense as they attempt to slow down one of the best rushing teams in the nation.
Where do the Oklahoma Sooners have an edge in their Big 12 showdown? Let’s take a look at this week’s By the Numbers!
Total Offense
Oklahoma: 6th (506 yards per game)
UCF: 4th (516.7 yards per game)
Edge: PUSH
Passing Offense
Oklahoma: 4th (341.2 yards per game)
Completion Percentage: 4th (73.3%)
UCF: 39th (270.3 yards per game)
Completion Percentage: 35th (64.5%)
Edge: Oklahoma
Rushing Offense
Oklahoma: 56th (164.8 yards per game, 4.1 yards per carry)
UCF: 3rd (246.3 yards per game, 6 yards per carry)
Edge: UCF
Scoring Offense

Oklahoma: 45.2 ppg (4th)
UCF: 35 ppg (27th)
Edge: Oklahoma
PFF Offense Rank

Oklahoma | UCF | |
Offense | 17 | 15 |
Passing | 11 | 43 |
Pass Blocking | 73 | 5 |
Receiving | 6 | 25 |
Rushing | 40 | 9 |
Run Blocking | 65 | 27 |
Total Defense

Oklahoma: 352.8 yards per game, 5 yards per play (53rd)
UCF: 387.2 yards per game, 5.7 yards per play (82nd)
Edge: Oklahoma
Pass Defense
Oklahoma: 239.2 yards per game (87th)
Completion Percentage Allowed: 55.3% (25th)
UCF: 190 yards per game (26th)
Completion Percentage Allowed: 53.5% (4th)
Edge: UCF
Run Defense

Oklahoma: 113.7 (29th)
Yards Per Carry Allowed: 3.3 (27th)
UCF: 197.2 (123rd)
Yards Per Carry Allowed: 4.9 (119th)
Edge: Oklahoma
Scoring Defense

Oklahoma: 14 ppg (t-7th)
UCF: 27.8 ppg (88th)
Edge: Oklahoma
PFF Defense Rank

Oklahoma | UCF | |
Defense | 13 | 78 |
Run Defense | 8 | 78 |
Tackling | 28 | 73 |
Pass Rush | 33 | 92 |
Coverage | 31 | 74 |
Sacks Per Game
Oklahoma: 2.33 (t-56th)
UCF: 2.33 (t-56th)
Edge: PUSH
Sacks Allowed Per Game
Oklahoma: 0.83 per game (t-9th)
UCF: 2.17 (t-78th)
Edge: Oklahoma
Third Down Offense

Oklahoma: 10th (51.9%)
UCF: 13th (50%)
Edge: PUSH
Third Down Defense

Oklahoma: 10th (28.9%)
UCF: t-114th (45.9%)
Edge: Oklahoma
Turnover Differential Per Game

Oklahoma: +1.83 (1st)
UCF: -0.83 (t-118th)
Edge: Oklahoma
Red Zone Offense
Oklahoma: 23rd (90.9%)
UCF: 106th (70.6%)
Edge: Oklahoma
Red Zone Defense
Oklahoma: t-3rd (63.6%)
UCF: t-65th (81.8%)
Edge: Oklahoma
Contact/Follow us @SoonersWire on Twitter, and like our page on Facebook to follow ongoing coverage of Oklahoma news, notes, and opinions. You can also follow John on Twitter @john9williams.

