February 2022 Housing Statistics
What does the housing market look like for the start of 2022? See below for the Greater Lansing Association of REALTORS® analysis of latest local statistics.
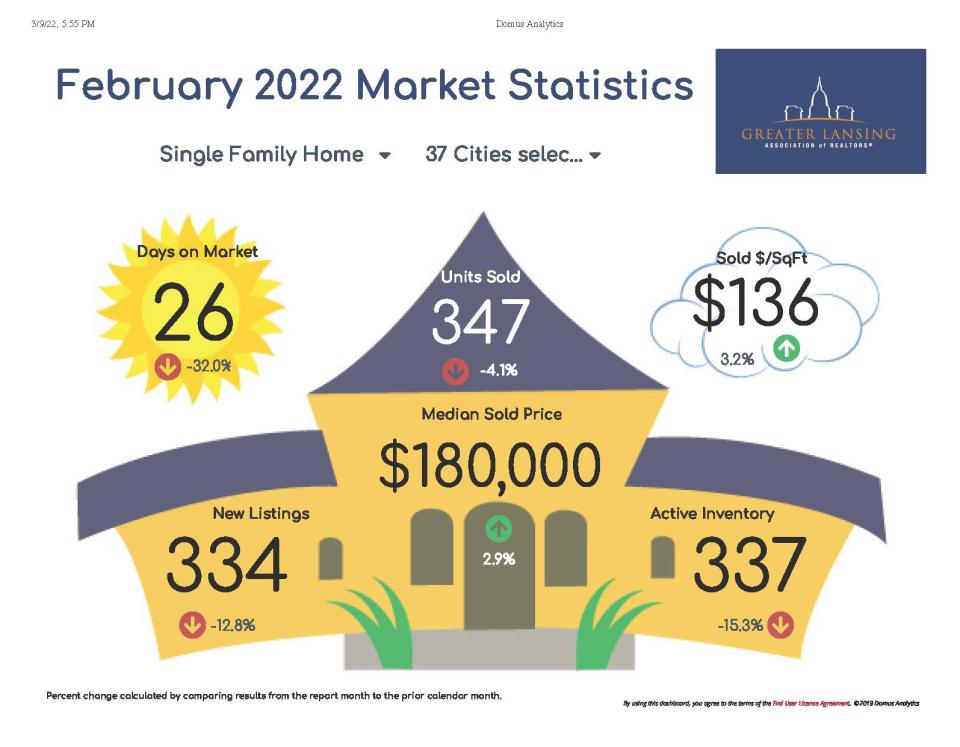
Median Sold Price
Starting off the year, the median sold price is slightly down.
January 2022’s median sold price was $174,900, a five percent decline from December 2021. The median sold price in January 2021 was nearly identical at $175,000.
Along with the median sold price, the sold price per square footage is also slightly decreased. The average price per square footage in January 2022 was $133 compared to $137 in December 2021 and $127 in Janury 2021.
The municipality in the local area with the highest median sold price in January 2022 was Eagle with a median sold price of $430,500. The next highest municipality was Okemos at $340,000.
Units Sold
A total of 350 units were sold in January. This is about 33 percent, or 170 units less than in December 2021.
However, this number is not unusual for January. This is a similar figure to January 2021 which had 366 units sold.
The local municipality with the most units sold in the Mid-Michigan area is Lansing. It leads the way by far with 157 units sold. The next highest selling municipality is East Lansing with 27 units sold.
New Listings
Despite winter being a less popular time to sell than spring, new listings are on the rise. January 2022 saw a total of 379 new listings compared to December 2021 which had 312 new listings, a near 22 percent increase. This is also higher than January 2021, which had 338 new listings.
Active Inventory
Inventory is down almost 15 percent from December 2021. January had an active inventory of 377 units compared to 442 active units in December. This is also quite a bit lower than January 2021which had an active inventory of 454 units.
If you have been thinking about selling your house, it may be a great time to do so as it continues to be a seller’s market. The average of the percentage of ask received by sellers is nearly 100 percent.
Days on Market
The number of days a unit spends on the market has increased 19 percent since December. On average, homes in January 22 were on the market for an average of 40 days compared to 33 days in December. This number is right on par with January 2021 which had an average of 39 days on market.
Remember, real estate is all about location, location, location, so statistics will vary based on area. Statistics in the infographic provided are based on averages for all municipalities in the mid-Michigan region and do not identify a specific location except when noted. All statistics mentioned refer to single family housing.
Are you interested in buying or selling your home? Contact a local real estate professional to help navigate through these market conditions. Visit www.lansing-realestate.com for a list of local REALTORS®, lenders, inspectors, and more.
This article originally appeared on Lansing State Journal: January 2022 Housing Statistics

