
Parks with most impact on Fantasy Baseball pitchers

Michael Salfino
Special to Yahoo Sports
Sometimes when things look wrong, they are wrong. And I made a rookie mistake with the numbers in the prior version of this piece, which looked at pitching environment. You have my deepest apologies. I do my best to double check this data but the problem here was hard to catch because I thought I was pulling how the hitters in each division fared against all the pitchers but what I was actually pulling was how the pitchers in the division fared against all the hitters.
So instead of this (which actually is pitchers vs. hitters):
NL East: .725
NL Central: .739
NL West: .744
AL East: .726
AL Central: .751
AL West: .749
The numbers for hitters in each division vs. all pitchers (what I intended to pull) is this:
NL East: .718
NL Central: .746
NL West: .739
AL East: .756
AL Central: .741
AL West: .734
This fortunately does not change any of the recommendations.
Every team plays 76 games in its division, or 47 percent of the schedule. We can quibble with the NL West numbers, for example, saying this is a product of just games in Colorado and Arizona and when you’re not pitching there, it’s no worries. But every non-Rockie and non-Diamondback pitcher in that division ends up pitching an expected 23.4 percent of their starts in those two parks.
For park factors, I used FantasyPros three-years averages focusing only on runs. People who I respect tend to focus more on homers but I think that’s unwise. If a park is up for homers but neutral for runs, it’s a neutral ERA environment, period. There’s nothing special about how a pitcher gives up his runs.
Combining these two factors, of course, Colorado is awful. When I adjust for half the games being at home and 23.5 percent of games being in the division on the road, I get about a 16 percent drag on the averages for pitchers there. But then it drops down to less than half of that for the next worst environment, Fenway Park. After that, the Indians (even though Progressive Field has been considered at times a pitcher’s park), Diamondbacks and Rangers at 5.4 percent to 4.3 percent headwind in runs/hitting. Next is Kansas City — but at just 2.6 percent.
[Sign up for Yahoo Fantasy Baseball: Get in the game and join a league today]
The best teams for pitchers based on home park and divisions are the Mets, Dodgers and Mariners (you can basically pretend they are in the National League). But the Angels, Phillies and Cubs also are sneaky good pitching environments based on this data.
I suggest you limit this data to breaking ties. There’s a chance that this is already baked into Yahoo ADP, but I’m skeptical. For example….
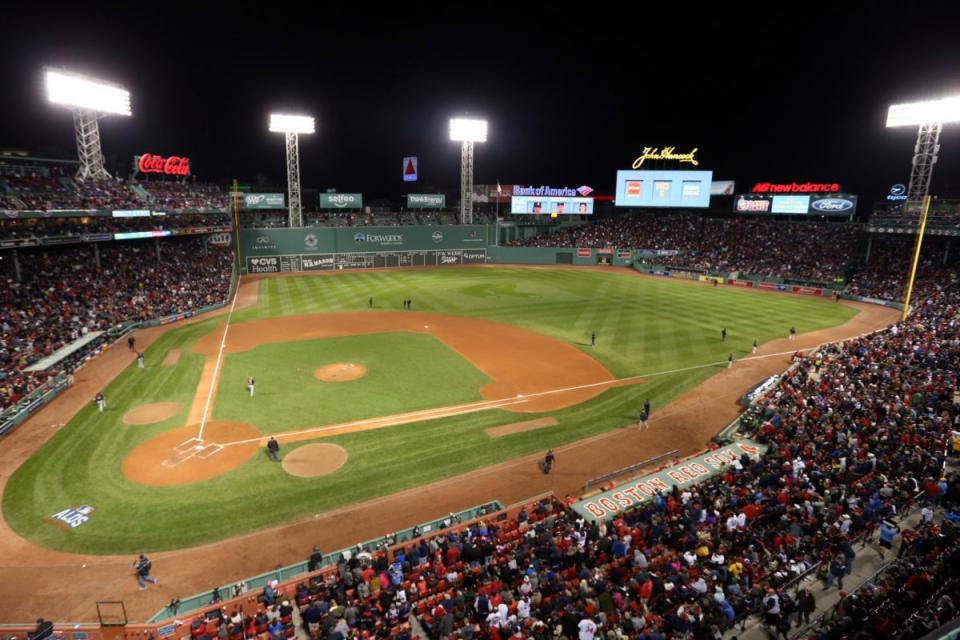
Chris Sale (ADP 22): Remember, we’re going against the grain and saying pitching in the AL Central was TOUGHER than pitching in the AL East (based on that OPS data). But U.S. Cellular Field (which, sigh, now is Guaranteed Rate Field, which just rolls right off he tongue) was for the last three years a very slight drag on runs, according to Fantasy Pros. Fenway is about 18 percent boost for scoring for left-handed pitchers. I wrote for The Wall Street Journal about lefties in Fenway.
Corey Kluber (ADP 27) vs. Yu Darvish (ADP 42): I strongly suspect this is all about perceived environment: Texas is bad. But actually, Cleveland/Progressive Field has been tougher for hurlers. There’s no way these guys should otherwise be separated by a round. I won’t fight you if you pick Kluber first given Darvish’s injury history. But Darvish pitched great last year. They’re at best a tossup.
Aaron Sanchez (ADP 121) vs. Michael Fulmer (ADP 120): Fulmer sometimes gets selected over Sanchez because of perceived environmental differences that are very minimal (pitching for Toronto only about 1 percent worse in the model). So if you think Sanchez is better, just pick him. And that goes for all AL East pitchers outside of Boston. Pitching for the Yankees is about neutral in our model and ditto the Orioles. And pitching for the Rays has the 13th best environment adjusting for park and division.
Lance McCullers (ADP 149): Any excuse I can use to highlight McCullers, I’m going to go for. He could break down inside 100 innings and it wouldn’t surprise anyone, but he also could win the Cy Young. Strictly when it comes to scoring, the past three years, runs in Houston/Minute Maid Park work out to 96.2 on a scale where 100 is exactly average. Note that the centerfield fence was brought in significantly this year, from 436 to 409 feet.
Aaron Nola (ADP 148), Vince Velasquez (ADP 170), Jerad Eickoff (ADP 202): Your goal should be to roster one of these guys. I prefer them in that order and, relative to ADP, peg Velasquez as the best choice. But there’s a general belief that pitching in Philly is bad and that has not been true. Not only do you get the NL East tailwind, but indexed runs at Citizens Bank Park is just 95.7. Marlins Park, where the fences have now been moved in, was 95.5 the past three years.
Finally, no one really knows how Atlanta is going to play. There’s a belief the wind will be blowing out most days, but I don’t think of Atlanta as The Windy City. If you want to get your bearings about it, I suggest you read this deep dive on SunTrust Park, but I would treat it as neutral until we get significant data (probably not until late summer).

