Statistically speaking: Indiana’s rushing defense takes another hit against Rutgers
BLOOMINGTON — Indiana football's rushing defense is becoming just as much of a problem as the offense.
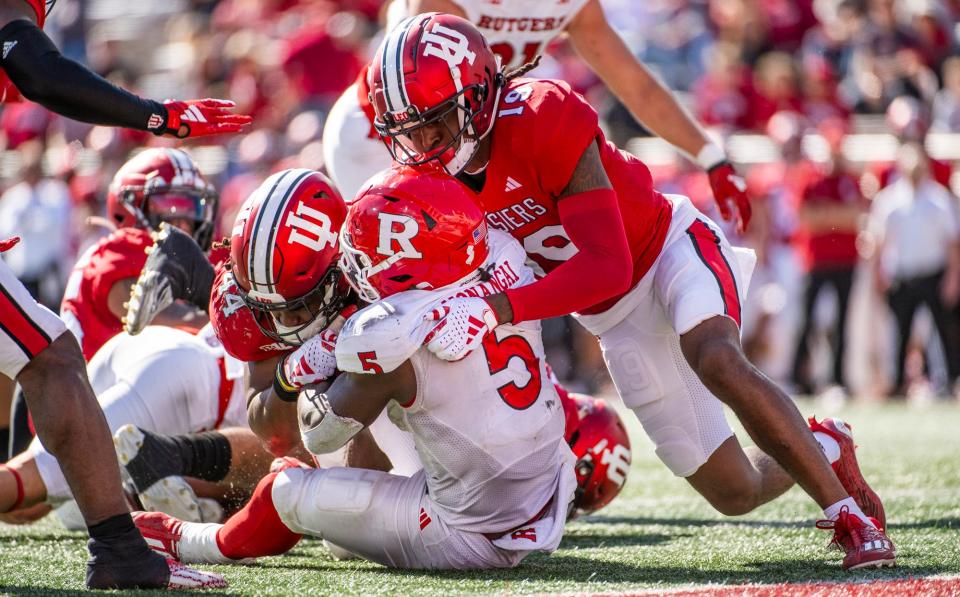
The Hoosiers gave up 276 rushing yards on Saturday in a 31-14 loss to Rutgers. It was the most they have allowed this season and ranks among the worst performances against the run during coach Tom Allen’s tenure.
It was the third time in four games they have allowed more than five yards per carry and three rushing touchdowns.
More: Why Indiana football is moving foward with Brendan Sorsby at quarterback
Here is where Indiana ranks nationally and in the Big Ten in 2023:
Total Offense
2017: 395.8 (t-69th, 6th)
2018: 415.2 (52nd, 7th)
2019: 432.8 (41st, 3rd)
2020: 359.5 (94th, 10th)
2021: 289.7 (124th, 14th)
2022: 328.3 (110th, 12th)
After Ohio State: 153.0 (133rd, 14th)
After Indiana State: 355.5 (91st, 10th)
After Louisville: 356.0 (89th, 9th)
After Akron: 337.5 (103rd, 12th)
After Maryland: 334.2 (109th, 12th)
After Michigan: 317.2 (120th, 11th)
After Rutgers: 311.7 (118th, 11th)
Why: Indiana had 279 yards of total offense in the loss to Rutgers. It was the fourth time this season the offense had less than 300 yards.
Passing Offense
2017: 265.7 (35th, 3rd)
2018: 257.8 (36th, 3rd)
2019: 302.4 (15th, 2nd)
2020: 250.9 (43rd, 5th)
2021: 175.5 (113th, 10th)
2022: 217.4 (87th, 8th)
After Ohio State: 82.0 (132nd, 14th)
After Indiana State: 213.0 (84th, 8th)
After Louisville: 241.7 (65th, 7th)
After Akron: 228.8 (82nd, 9th)
After Maryland: 224.0 (80th, 9th)
After Michigan: 210.0 (93rd, 9th)
After Rutgers: 198.0 (102nd, 10th)
Why: Indiana had 126 passing yards on Saturday much of that came from Brendan Sorsby throwing for 58 yards on the opening drive.
Rushing Offense
2017: 130.1 (106th, 12th)
2018: 157.3 (80th, 9th)
2019: 130.4 (106th, 12th)
2020: 108.6 (114th, 12th)
2021: 114.7 (113th, 12th)
2022: 110.8 (112th, 13th)
After Ohio State: 71.0 (117th, 12th)
After Indiana State: 142.5 (81st, 11th)
After Louisville: 114.3 (109th, 12th)
After Akron: 108.8 (114th, 13th)
After Maryland: 110.2 (114th, 12th)
After Michigan: 107.2 (118th, 13th)
After Rutgers: 113.71 (112th, 12th)
Why: Indiana had 153 rushing yards (5.3 yards per carry), it was the second most rushing yards for the offense this season.
More: Indiana football safety Noah Pierre will miss 'extended period of time'
Points Per Game
2017: 26.8 (77th, 6th)
2018: 26.4 (t-88th, 10th)
2019: 31.8 (t-42nd, 5th)
2020: 28.9 (59th, 4th)
2021: 17.3 (123rd, 13th)
2022: 23.3 (t-99th, 10th)
After Ohio State: 3.0 (128th, 14th)
After Indiana State: 22.0 (t-104th, 11th)
After Louisville: 19.3 (t-114th, 13th)
After Akron: 21.8 (t-103rd, t-11th)
After Maryland: 20.8 (t-113th, 13th)
After Michigan: 18.5 (t-125th, 14th)
After Rutgers: 17.9 (124th, 14th)
Why: Indiana scored 14 points in the loss to Rutgers, it was the fifth time this season the offense was held to less than 20 points.
Sacks Allowed
2017: 29 total, 2.4 per game (t-75th, t-8th)
2018: 27 total, 2.3 per game (t-59th, t-7th)
2019: 27 total, 2.1 per game (t-67th, 7th)
2020: 10 total; 1.25 per game (t-18th, 2nd)
2021: 29 total; 2.4 per game (t-74th, t-9th)
2022: 38 total; 3.2 per game (t-107th, t-12th)
After Ohio State: 1 total, 1 per game (t-35th, t-5th)
After Indiana State: 2 total, 1 per game (t-27th, t-5th)
After Louisville: 2 total, .67 per game (t-12th, t-3rd)
After Akron: 5 total, 1.25 per game (t-30th, t-6th)
After Maryland: 8 total, 1.60 per game (t-50th, t-9th)
After Michigan: 12 total, 2.00 per game (t-55th, 9th)
After Rutgers: 12 total, 1,71 per game (t-42nd, t-8th)
Why: Indiana’s offensive line didn’t allow a sack, and only allowed seven quarterback pressures, according to Pro Football Focus.
3rd Down Conversion Pct
2017: 37.9% (87th, 5th)
2018: 42.4% (39th, 4th)
2019: 46.9% (t-15th, 4th)
2020: 38.3% (76th, 5th)
2021: 36.9% (89th, 10th)
2022: 33.5% (111th, 12th)
After Ohio State: 33.3% (t-88th, t-8th)
After Indiana State: 54.8% (21st, 2nd)
After Louisville: 50.0% (27th, 3rd)
After Akron: 43.1% (56th, 8th)
After Maryland: 40% (t-75th, 10th)
After Michigan: 40% (t-69th, 8th)
After Rutgers: 37.6% (t-87th, 9th)
Why: Indiana was 2 of 11 (18.2%) on third downs, it was the first time the offense didn't convert at least 20% of their third-down attempts.
Total Defense
2017: 340.1 (27th, 6th)
2018: 423.8 (83rd, 11th)
2019: 352.2 (36rd, 9th)
2020: 378.1 (43rd, 5th)
2021: 383.8 (69th, 10th)
2022: 449.3 (119th, 14th)
After Ohio State: 380.0 (90th, 12th)
After Indiana State: 236.5 (15th, 6th)
After Louisville: 298.3 (t-39th, 7th)
After Akron: 342.3 (57th, 8th)
After Maryland: 368.2 (t-68th, 10th)
After Michigan: 374.4 (69th, 12th)
After Rutgers: 366.1 (60th, 12th)
Why: Indiana allowed 315 total yards of offense.
Passing Defense
2017: 179.7 (17th, 4th)
2018: 240.6 (81st, 10th)
2019: 213.7 (46th, 10th)
2020: 241.0 (75th, 10th)
2021: 235.7 (76th, 11th)
2022: 274.2 (120th, 14th)
After Ohio State: 237.0 (86th, 13th)
After Indiana State: 129.0 (11th, 5th)
After Louisville: 165.3 (20th, 3rd)
After Akron: 176.8 (23rd, 4th)
After Maryland: 211.8 (t-50th, t-7th)
After Michigan: 217.2 (52nd, 8th)
After Rutgers: 192.1 (23rd, 7th)
Why: Rutgers only had 39 passing yards (5 of 12), it was the second time IU allowed less than 50 yards passing this season.
Rushing Defense
2017: 160.4 (61st, 9th)
2018: 183.2 (83rd, 10th)
2019: 138.5 (43rd, 9th)
2020: 137.1 (34th, 5th)
2021: 148.1 (59th, 8th)
2022: 175.1 (99th, 11th)
After Ohio State: 143.0 (88th, 10th)
After Indiana State: 107.5 (57th, 9th)
After Louisville: 133.0 (t-79th, 12th)
After Akron: 165.5 (t-103rd, 12th)
After Maryland: 156.4 (93rd, 12th)
After Michigan: 157.5 (92nd, 12th)
After Rutgers: 174.43 (108th, 14th)
Why: Indiana allowed 276 yards rushing, the second most since 2021.
Points Per Game Allowed
2017: 25.3 (t-52nd, 10th)
2018: 29.9 (81st, 10th)
2019: 24.4 (45th, 9th)
2020: 20.3 (19th, 4th)
2021: 33.3 (109th, 14th)
2022: 33.9 (120th, 14th)
After Ohio State: 23.0 (76th, 11th)
After Indiana State: 15.0 (t-34th, 9th)
After Louisville: 17.0 (t-41st, 8th)
After Akron: 19.5 (43rd, 8th)
After Maryland: 24.4 (t-66th, 11th)
After Michigan: 29.0 (t-91st, 13th)
After Rutgers: 29.3 (97th, 13th)
Why: Indiana gave up 31 points, the defense has now given up 30 or more points in three straight games.
Sacks
2017: 36 total, 3 per game (t-21st, 5th)
2018: 22 total, 1.8 per game (t-97th, 10th)
2019: 27 total, 2.1 per game (t-66th, t-8th)
2020: 25 total, 3.1 per game (t-31st, 1st)
2021: 17 total, 1.4 per game (t-115th, 14th)
2022: 20 total, 1.7 per game (t-104th, t-11th)
After Ohio State: 0 total, 0 per game (t-133rd, t-14th)
After Indiana State: 4 total, 2.0 per game (t-66th, t-9th)
After Louisville: 6 total, 2.0 per game (t-74th, t-10th)
After Akron: 8 total, 2.0 per game (78th, 10th)
After Maryland: 8 total, 1.6 per game (t-95th, 10th)
After Michigan: 12 total, 2.0 per game (t-91st, 9th)
After Rutgers: 13 total, 1.86 per game (100th, t-11th)
Why: Indiana defensive tackle Nick James had the team’s lone sack.
3rd Down Conversion Pct Defense
2017: 29.9% (8th, 3rd)
2018: 42.0% (96th, 11th)
2019: 35.2% (34th, 5th)
2020: 37.5% (39th, 5th)
2021: 36.8% (40th, 7th)
2022: 42.4% (105th, 13th)
After Ohio State: 16.7% (t-13th, 2nd)
After Indiana State: 17.4% (4th, 2nd)
After Louisville: 31.4% (27th, 3rd)
After Akron: 30.8% (21st, 3rd)
After Maryland: 33.3% (t-32nd, 4th)
After Michigan: 36.5% (51st, 8th)
After Rutgers: 36.5% (55th, 9th)
Why: Rutgers was 4 off 11 on third down attempts, and 1 of 2 on fourth down attempts.
Turnover Margin
2017: Minus-7 (t-105th, 12th)
2018: Plus-5 (t-34th, t-5th)
2019: Plus-2 (t-50th, 6th)
2020: Plus-8 (t-12th, 3rd)
2021: Minus-13 (128th, 14th)
2022: Minus-5 (t-102nd, 12th)
After Ohio State: Plus-1 (t-23rd, t-2nd)
After Indiana State: Plus-1 (t-43rd, t-6th)
After Louisville: Plus-1 (t-47th, t-6th)
After Akron: Plus-2 (t-36th, t-6th)
After Maryland: Plus-1 (t-48th, t-7th)
After Michigan: Minus-4 (t-103rd, 11th)
After Rutgers: Minus-4 (t-105th, 12th)
Why: Indiana didn’t have any turnovers, but didn’t create any either.
Penalties Yards Per Game
2017: 58.9, 5.9 per game (92nd, 9th)
2018: 60.8, 5.9 per game (87th, 7th)
2019: 63.8, 6.8 per game (111th, 14th)
2020: 44.8, 4.3 per game (32nd, 6th)
2021: 42.7, 4.7 per game (21st, 5th)
2022: 44.0, 5.0 per game (27th, 6th)
After Ohio State: 75.0, 8 per game (t-109th, 13th)
After Indiana State: 67.5, 7.5 per game (108th,13th)
After Louisville: 51.7, 6.3 per game (t-70th, 9th)
After Akron: 51.3, 6.0 per game (t-66th, 8th)
After Maryland: 47.0, 5.6 per game (50th, 8th)
After Michigan: 47.0, 5.5 per game (45th, 7th)
After Rutgers: 48.1, 5.4 per game (53rd, 8th)
Why: Indiana had five penalties for 55 yards against Rutgers.
Michael Niziolek is the Indiana beat reporter for The Bloomington Herald-Times. You can follow him on Twitter @michaelniziolek and read all his coverage by clicking here.
This article originally appeared on The Herald-Times: Where Indiana ranks statistically after loss to Rutgers

