Dr. Diandra: Short tracks stymie NASCAR's Next Gen race car
Intractable (adjective): very difficult or impossible to control, manage or solve.
NASCAR set a challenging goal in trying to design a car capable of running any track with minimal modifications at moderate cost. They should be commended for the attempt. But the dual constraints of maximum versatility and minimum cost are impossible to simultaneously satisfy.
NASCAR, famous for making boxes, have made a box they seemingly cannot escape. They took on a difficult — perhaps intractable — problem. They haven't been able to solve it. But IndyCar and Formula One have the same challenges and neither has arrived at a perfect answer, either.
NASCAR Truck, Xfinity, Cup weekend schedule at Texas
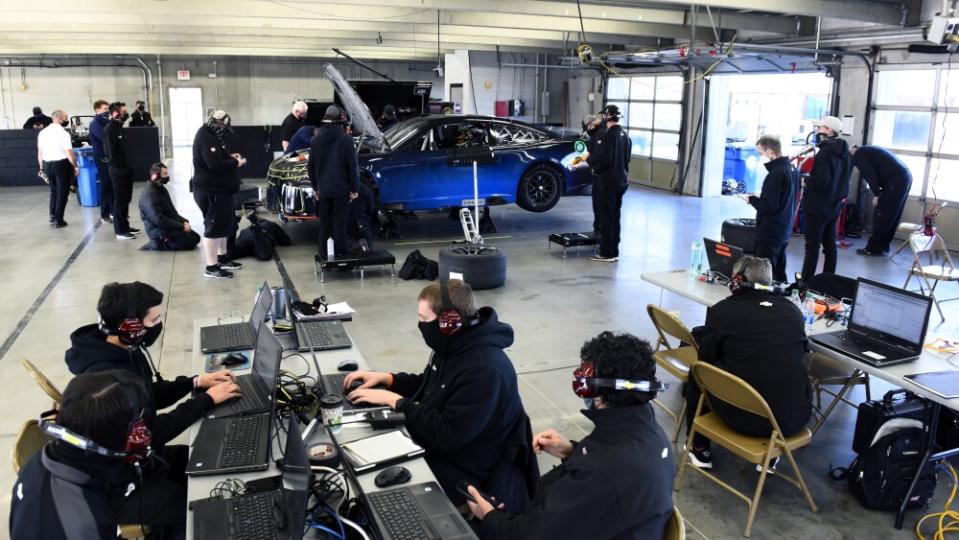
NASCAR teams take on the second intermediate track of the 2024 season.
NASCAR’s first attempt at a universal race car was the Gen-5 (Car of Tomorrow), which introduced a spec chassis that incorporated cutting-edge safety research. The car was not well received, in part because NASCAR imposed the car on teams without asking for input, and in part because it was generically homely.
The Gen-6 car retained Gen-5’s safety advances and added manufacturer identity, balancing aerodynamics among different makes to ensure a level playing field. NASCAR continued to experiment with relatively simple changes like spoiler height or radiator pan configuration to tweak the car for different tracks.
The Next Gen car, with its sleek, carbon fiber underbody, revitalized racing at mile-and-a-half tracks but struggles at smaller tracks. The new short-track package has made little difference at the small ovals (Phoenix, Richmond and Martinsville) this year.
Because fans often cite lead changes as a measure of a ‘good race’, I used NASCAR’s lead change stats. These numbers award credit to one driver for leading each lap at the start/finish line. They do not include passes during a lap, or passing in the rest of the field.
I'll summarize my conclusions and then take you through the data.
The quality of short-track racing varies widely over different car generations and even within a single generation. The problems didn't all originate with the Next Gen car.
Passes for the lead haven't changed significantly at Phoenix since the Gen-4 car. The numbers of total lead changes are the same, and the numbers of green-flag passes are constant from the Gen-6 to the Next Gen car.
Total lead changes at Richmond are up with the Next Gen car; however, the Next Gen continues a trend that started in 2020, with fewer cautions and more lead changes due to green-flag pit cycles. The average number of green-flag passes is down in the Next Gen relative to Gen-6.
Racing at Martinsville reached its peak in terms of lead changes with the Gen-5 car. The other generation cars have all produced races with few lead changes. But only since the Next Gen car have there been green-flag pit stops — and only in the spring races. That suggests the stage lengths are too short compared to the tire durability.
The diversity of lengths, shapes and surfaces precludes a simple fix.
NASCAR has already said they’ve done what they can with aero changes. Trying to engineer a tire that wears faster is an attractive option that transfers the cost to Goodyear and the teams.

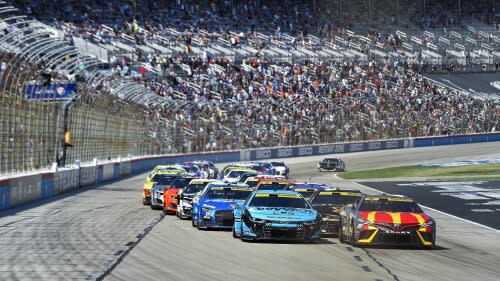
Good news, bad news for NASCAR Cup teams ahead of Texas weekend
The Cup Series races Sunday afternoon at the 1.5-mile speedway.
But faster-wearing tires may not be enough.
That leaves changes that would necessarily require larger investments. It's a sore topic at the moment, as teams and NASCAR have yet to reach an agreement on how to split money from the next media package.
But that's what it may come down to. The teams, the manufacturers and NASCAR sitting down and figuring out how much money owners and NASCAR are willing to spend to improve the racing at these tracks.
Here's the data that led me to those conclusions.
Phoenix
The plot below shows lead changes at Phoenix from 1991 to this year’s race, with colors denoting car generation. I split the Gen-5 car into 5a (the car with the original wing) and 5b (the car with a spoiler.)
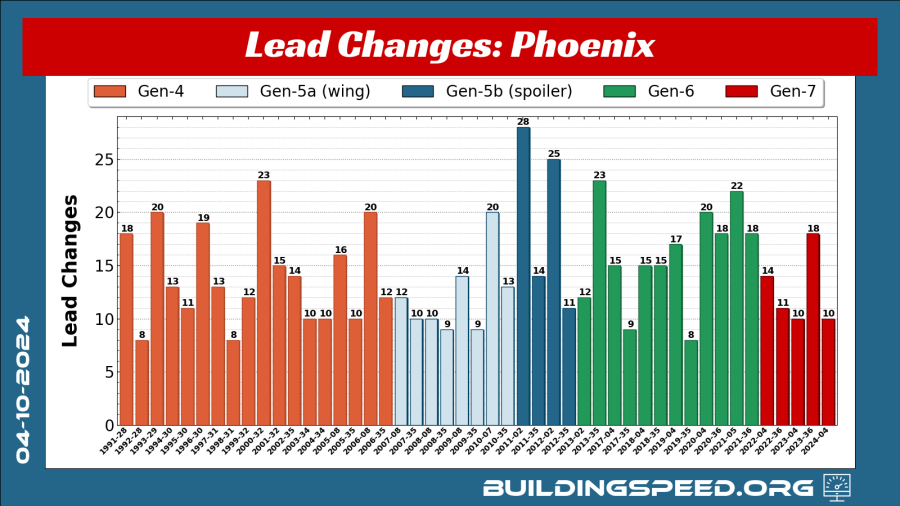
This plot shows that there are no significant differences in lead changes with different cars. The four races of the Gen-5b car had an average of 19.5 lead changes per race. Other car versions range from an average of 12 to 16 lead changes per race.
The 12.6 average lead changes per race in the Next Gen car are on the low end of that range, but still within it. The Next Gen car hasn’t produced fewer than 10 lead changes in a race, nor more than 18.
Because it makes a difference whether a lead change happens on track or in the pits, I broke down the data by type of lead change.
GF is a green-flag pass on track.
GF-R is a pass made on a restart or at the race start.
Lead changes starting with INH indicate that the driver inherited the lead due to something someone else did, like pit or spin. I think of it as a passive lead change.
ONPR means that the lead was taken by passing on pit road. Sometimes that’s due to whose pit box is past start/finish and sometimes it’s a measure of who had the faster pit stop.
BTL means ‘beat to the line.’ Current rules allow the driver on the front row who is not the leader to beat the leader to the start/finish line. When that happens, they are credited with leading the last yellow-flag lap of the caution. If they hold on to the lead, I classify it as GF-R. If the lead was just for that one lap, it gets assigned BTL.
I only have sufficient data going back to 2017 for this analysis, but even that limited range is useful. The graph below shows the lead-change breakdown for Phoenix. Focus on the green, unhatched boxes at the bottom of each column that represent true green-flag passes for the lead.
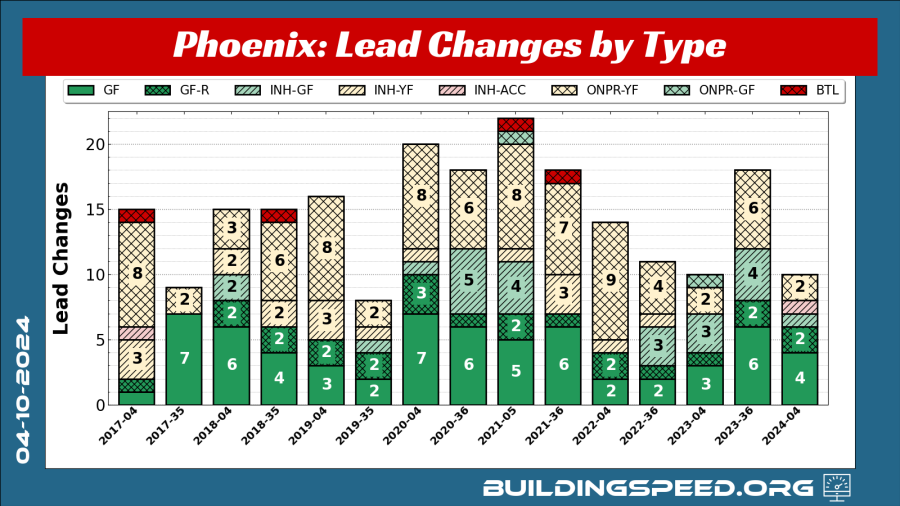
If you didn’t know where the car generations changed, you likely wouldn’t be able to tell from this graph. In the stage racing era, Phoenix races have had between one and seven green-flag passes. Last fall’s championship race had six green-flag passes, the second-highest number of the races included. This year’s race had four green-flag passes.
Racing at Phoenix is about the same in the Next Gen as it was in the Gen-6 car.
Richmond
The graphic below shows that the Next Gen car provided a significant increase in lead changes at Richmond over the Gen-6. In fact, the Next Gen car has the highest average number of lead changes per race.
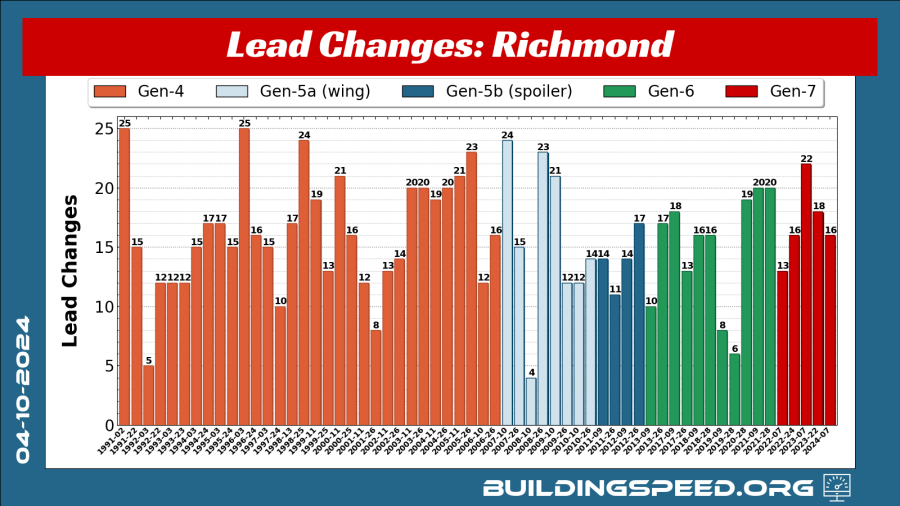
Breaking down the types of lead changes shows that the Next Gen car has produced slightly fewer green-flag passes on average than the Gen-6 car. Last spring’s race featured seven green-flag passes, the second-highest number in any stage-racing-era race at Richmond.
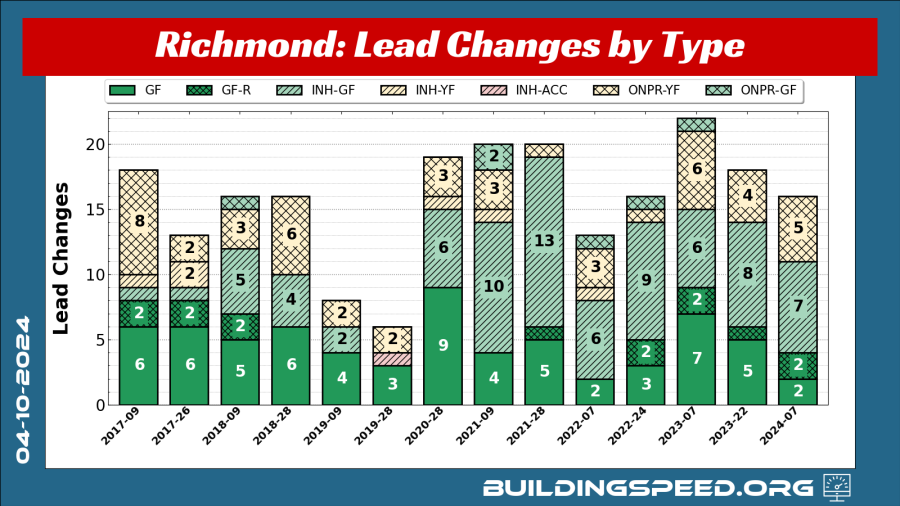
The increase in total number of lead changes in the Next Gen car is primarily due to increases in green-flag pit stops. Those, in turn, are due to fewer cautions. There were only two green-flag passes at this year’s Richmond race and both came while cars were on wet weather tires.
The increase in green flag pitstop induced lead changes (INH-GF) isn’t new with the Next Gen car. It started around 2020.
Martinsville
Martinsville shows a different pattern, even accounting for the fact that the last three spring races were reduced from 500 laps to 400.
Last week’s Martinsville race featured 13 lead changes in 415 laps, which corresponds to 15.7 lead changes in 500 laps. That, in turn, is consistent with the mean number of lead changes in Gen-6 races.
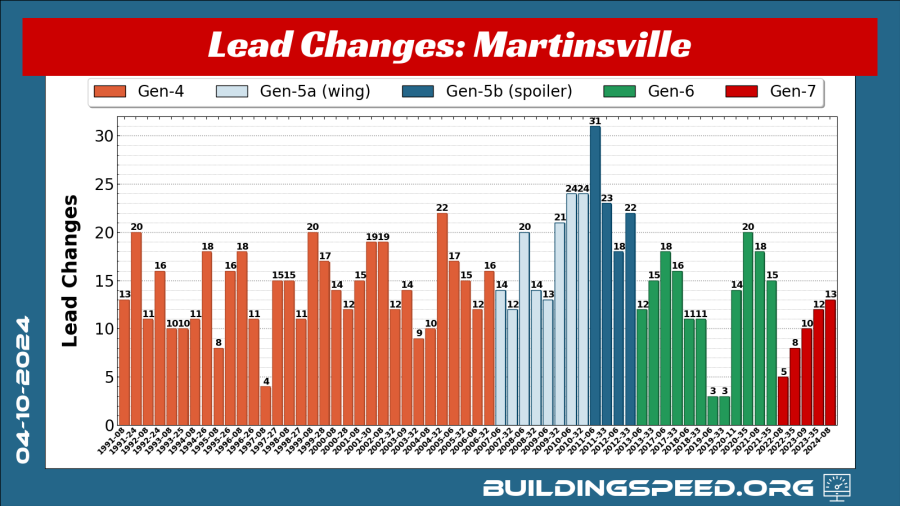
While the first races with the Next Gen car had minimal passing, this graph shows that the Gen 6, and even the Gen-4 car, have had races with fewer lead changes.
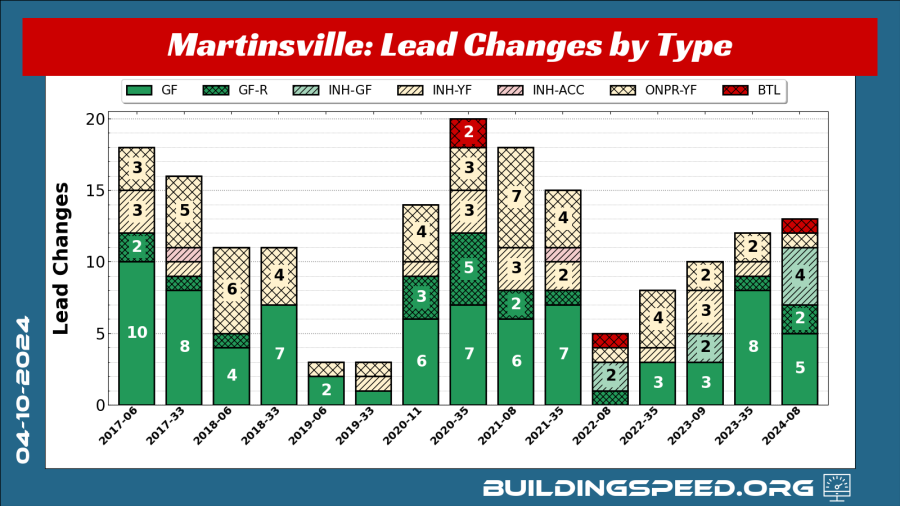
Unlike Richmond, the phenomenon of green-flag pit stops only started at Martinsville with the introduction of the Next Gen car -– and only in spring races. The fall 2023 race was the best for green-flag lead changes with the Next Gen car, with eight green-flag passes. That ties or beats all Gen-6 races except one.

