Depth or competition: What statistical forecasts say about Andy Dalton and Dak Prescott
By Kevin Cole
Cincinnati gave Andy Dalton what he wanted and released him last week, and it didn’t take long for the Bengals’ franchise leader in career touchdowns to find a new home.
The Dallas Cowboys signed Dalton to a reported one-year contract worth $3 million guaranteed and up to a total of $7 million with incentives.
The money involved in the transaction paints Dalton’s role as that of a backup. However, his extensive history as a starter, including five straight playoff appearances from 2011-15, and the contract limbo of starting quarterback Dak Prescott, has fed into suspicions that the signing could affect Prescott’s future with the team. Early reactions to the signing have ranged from reading too much into it to reading way too much into it.
Dalton was signed to be Prescott’s backup — full stop. And it’s the kind of smart move that any team with a championship-caliber roster should pursue. If everything goes according to plan, Dalton will serve only as an insurance policy for Prescott this season and the Cowboys will extend their franchise quarterback sometime in the next few months.
Prescott is likely a better quarterback than Dalton, but figuring exactly how likely that is, and how likely it is that Prescott continues his stellar play of last season, can tell us a lot about how to view the quarterbacks room in Dallas.
How we’re evaluating Dak vs. Dalton
In this analysis, I’m going to use the passing grades and dropback efficiency of every single play of Prescott and Dalton’s careers to forecast them going forward.
The results will be a range of outcomes for their true passing ability in terms of PFF passing grades and expected points added (EPA, an advanced efficiency metric), by properly weighing results and priors — or pre-NFL expectations — based on their respective draft positions.
The technique used is called Bayesian updating.
Passing grade distributions reveal Dak has higher ceiling
The end result of Bayesian updating is the range of outcomes. And first, we’ll look at it through the prism of PFF passing grades. Taking into account the distribution of career passing grades for all quarterbacks and the individual results for Prescott and Dalton until this point in their respective careers, we produce the results below.
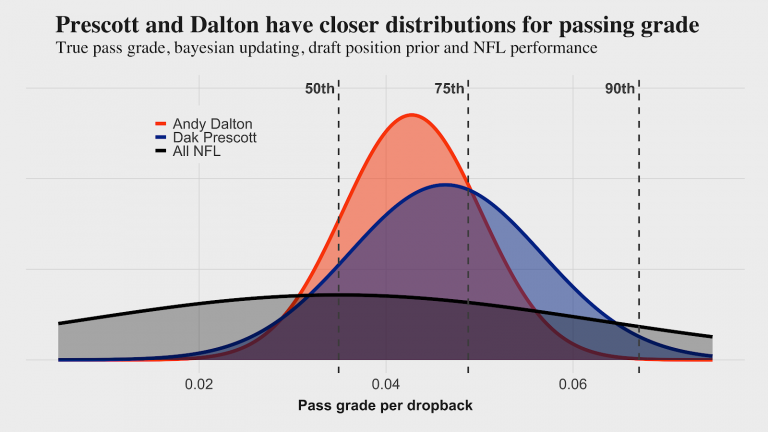
Dalton’s distribution is taller and narrower than Prescott’s because he has a larger sample of dropbacks (4,882 vs. 2,314). The peak is further to the right because he hasn’t performed as well throughout his career.
Our best guess for Dalton’s true PFF passing grade per dropback is between that of the 50th and 75th percentile of quarterbacks with at least 500 career dropbacks.
Prescott’s best-guess estimate is closer to the 75th percentile, and a larger section of his distribution is beyond the 75th percentile, with some even beyond the 90th percentile.
According to PFF passing grades, Prescott has roughly an equal floor to Dalton, and while there is a decent amount of overlap, he also has a higher ceiling.
Passing efficiency distributions frown on Dalton
When applying the same updating to passing efficiency — as measured by EPA per dropback — Prescott has a more substantial advantage compared to Dalton.
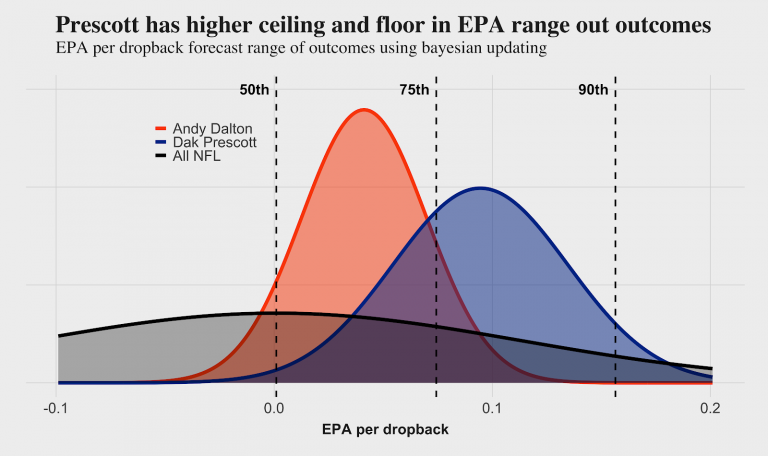
The majority of Prescott’s distribution is higher than that of the best-guess estimate for Dalton.
Prescott is viewed more favorably by efficiency stats than grades, which could either be the result of EPA failing to capture the context of a strong supporting cast or the inability of PFF grades to capture why Prescott has been so productive. Dalton, on the other hand, is viewed more favorably by grades than efficiency.
Bringing Dak, Dalton evaluations together
The flaws of viewing quarterback performance through either the lens of EPA or the lens of PFF passing grade can be mitigated to a degree by putting them together into a composite metric, which weighs each equally.
Bringing together the efficiency and grade distributions and then running 10,000 simulations produces exact probabilities that each quarterback’s true passing skill falls above the 50th, 65th and 80th percentiles, and it shows how likely one is better than the other.
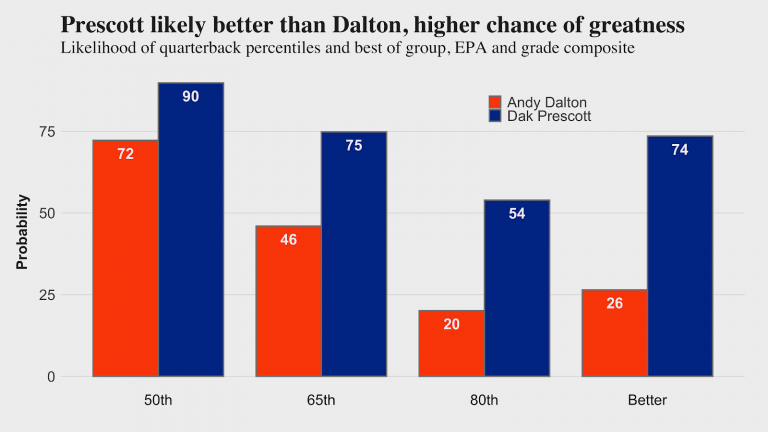
It’s substantially likely that both Prescott and Dalton are above-average passers by the composite measure, but Prescott’s upside is evident in the gap that forms between them for the 65th and 80th percentile threshold.
If the Cowboys are looking for elite or near-elite quarterback play — as every team should be — Prescott is the easy bet. As far as who is more likely to be the better passer, it’s roughly 3-to-1 for Prescott.
A 75 percent probability isn’t as overwhelming as you’d think. Events with a 25 percent probability happen one out of four times. It’s not something that you bet will happen with even odds, but it’s good to be prepared in case it does.
And that’s what makes Dalton such an effective insurance policy for the Cowboys, since for most backups, the percentage chance of being better is negligible.
It’s important to note that these numbers account for scrambles, but not the designed runs that Prescott has used effectively over his career. Over the past 10 seasons, Prescott has ranked fourth among all quarterbacks in EPA per season generated on designed runs, behind only Lamar Jackson, Cam Newton and Josh Allen.
Prescott was the most efficient quarterback with at least 50 designed runs in terms of EPA on a per-run basis. So, when you consider the additional value Prescott brings with his legs, the adjusted likelihood that he’s a better all-around quarterback than Dalton should rise materially above 80 percent.
For more statistical NFL analysis, go to PFF.com.
More from Yahoo Sports:

