NFL Injury Prediction
Sports Injury Predictor has partnered with Rotoworld in 2015 to give you an even greater chance of winning your league this coming season. As a quick introduction we have an algorithm that figures out which players are more likely to get injured in the coming season. We’re going to isolate some of the riskier high value players as well as point out who the safer players are as we help you ramp up your research for your upcoming drafts. Follow us on Twitter @injurypredictor and check out our injury search engine here for the complete injury history for every player in the NFL.
As this is our first article we thought we’d give you a very quick overview as to how our injury prediction algorithm works and then give you the skinny on what to look out for and what to ignore during the preseason as you begin thinking about who you will be targeting in this year’s drafts.
Most of us will do some kind of injury research on the players we are targeting in our drafts for the coming season. Why? Because injury represents risk and risk undervalues or overvalues assets depending on how it is interpreted.
A good analogy is how share prices are evaluated. Revenues, gross margin, compound annual growth rate and all other income related metrics will tell a story. But the price of the share is truly evaluated once risk is accounted for: What is happening in their market, how strong is the company’s leadership, whether they have a sustainable competitive advantage, etc.
You win at Fantasy Football when you avoid overvalued players and target undervalued players. Knowing the injury risk, especially for early round players, helps you do just that. With this information and a time machine you could have safely picked Adrian Peterson or Jamal Charles in the 3rd round in 2012 while avoiding McFadden in the 1st. You also would have avoided Julio Jones and Arian Foster in the first round in 2013. And last year you would have steered clear of Megatron and Andre Ellington at their draft prices.
Well in 2015 we’re going to help you navigate early round injury traps and give you the risk analysis you need to win your league. A quick snapshot of our results from 2014 is that we were correct 75% of the time when we identified players as high risk. Not only were they injured, they missed on average 3 games for the season (24 players fell into this category). Knowing who these riskier players are and conversely who the “safer” players are gives you a huge advantage against your opponents who may not have this information.
But before we go any further let’s take a quick look at some popular myths that are used to predict injury by most people who have something to say on the subject.
Age
You will read or hear that certain players reach a certain age at which they begin to “break down”. For running backs the age is usually around 27 and for wide receivers it’s usually given at around 29. Keep in mind we are talking about injury and not production. There has been a ton of research that conclusively shows that player production does decrease at certain milestones but we are solely interested in age being a predictor of injury.
We tested age extensively to see if it could be used as a signal and we found no correlation between age and injury. What we did find to be a useful signal was experience in the NFL. The relationship is actually the opposite of what you would expect. The more experienced players in the NFL (who happen to be older) have less of a chance of getting injured than their less experienced (younger) counterparts.
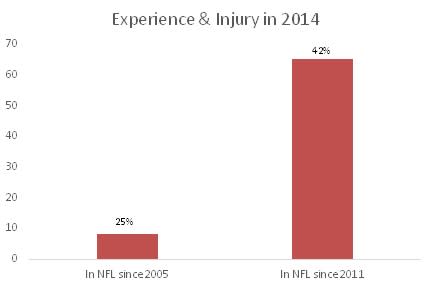
The graph above demonstrates that last year 42% of all players that had been in the NFL for 3 years or less suffered an injury that held them out of at least one game. In contrast, only 25% of players going into their 10th season suffered an injury that kept them out of more than one game.
What the graph does not show is that 48% of all rookies were injured or missed at least one game.
How is it possible that veterans are injured less as a group than their younger counterparts?
There could be several football reasons for this. The more experienced players come into the season better prepared than their younger team mates. They have refined their preseason workouts and nutrition down to a science. With their positions on the team secure (usually down to big contracts at this stage of their career) they take fewer risks on the field. Coaches give them preferential treatment and hold them out of mid-season training sessions to give them extra time to recover between games.
A statistical reason is that what we are seeing here is called survivor bias. The group of players in the more experienced bucket is made up of the toughest group of survivors who have made it this long into their career because they have survived and prevailed where the weaker players have not. Players who did not have the durability (Beanie Wells) retired earlier. The ones who made it into their late 20s and early 30s have the durability that got them there working in their favor (Michael Turner/Chris Johnson).
This fault in thinking presents an opportunity to find value picks in older players who the mainstream will consider too old and “injury-prone”. Players like Andre Johnson, Frank Gore and perhaps even Marshawn Lynch fall into this category (at the time of writing Lynch’s ADP is late 1st round but as he is the number 2 RB over the last 3 seasons one could say that represents value).
Previous workload
You will hear this way of thinking being applied to football players, especially running backs. It will sound like this: “Marshawn Lynch has had 250 carries 3 seasons in a row. This means that he has taken a lot of hits. Therefore he is more likely than another running back who has taken fewer hits to get injured in 2015.”
The players who step on to the field on a Sunday are the elite of the elite. They are some of the most athletic specimens to walk the planet. Not only are they in a physical state that 99.99% of the world’s population will never experience but their every waking moment is governed by teams of doctors, nutritionists, physiotherapists and conditioning coaches that ensure they are in a constant state of peak condition. And they have been doing this all their life.
To assume that there is a finite number of hits, yards, carries, receptions or whatever you want to place a number on as an indicator of injury ignores the fact that the people we are discussing are elite athletes who are paid huge sums of money to show up every Sunday. It also ignores that every player is different. 250 Lynch carries are way different from 250 CJ?K carries.
There is no statistical evidence that can conclusively show how previous touches or yards rushed for in prior seasons will determine the likelihood of a player getting injured the following season. To demonstrate this – for every running back you show me who has 300 plus carries the previous year who then went on to get injured in the following season, I will show you five rookie running backs who got injured in their first season with no prior NFL workload to speak of.
We look at injury as a linear event. You start at 0 (not injured) and the more you play you will move towards a 1 (injured). What exposes you to injury is how many times you WILL touch the ball in-season and not how many times you HAVE touched the ball. When you start to think of it this way you will see a flow develop between the projections for each player and the associated injury risk. The more exposure to the ball the more exposure there is to risk.
This is important because you will hear about players getting faded due to previous workload. That creates opportunity for you to cash in on the value that creates.
How we look at Injury Probability
After a lot of testing and several iterations of model design we approach injury prediction as follows:
Injury history: Our ever growing injury database goes back all the way to college for all the skill position players. This database goes back 14 years and has nearly 500 players injury history all stored in great detail.
Injury Correlation: Next we have our correlation matrix that weights the different injuries by investigating the relationship between them. By keeping a running count of which injuries lead to other injuries we are able to dynamically weight the chances of an injury reoccurring or causing another type of injury.
Biometrics: We also take into account biometric data such as age, weight and height as some physical profiles are more resistant to injury than others. For example, short, thick running backs tend to get hurt less than tall skinny ones.
Game data: Finally we use game data such as position and projected touches to act as a lever that defines the player’s exposure to risk. Players who touch the ball more often are more likely to get injured.
We take some other pieces of data into account but these are the main levers you will hear us discuss as we provide our analysis on the injury risk of various players. We provide a percentage number that will indicate how likely a player is to get injured in the coming season. We’re looking forward to providing you with the weekly analysis you’ll be able to use to dominate your drafts and your season.
For more information check out our site www.sportsinjurypredictor.com, follow us on Twitter @injurypredictor or get in touch with jake@sportsinjurypredictor.com.
