I listened to Garmin’s sleep recommendation and tracked my cycling performance - here’s the difference it really made
We all know that sleep is important for our health, fitness and wellbeing. Not only do we feel groggy and lethargic if we don’t get enough, but we’re bombarded by so many articles reminding us of the links between sleep, recovery and improved performance. We should know, we’ve written a fair few ourselves.
That’s all well and good knowing the theory. But I was interested to find out exactly what difference getting the ‘right’ amount of sleep makes for me - just how much of my fitness am I really sacrificing when burning the midnight oil?
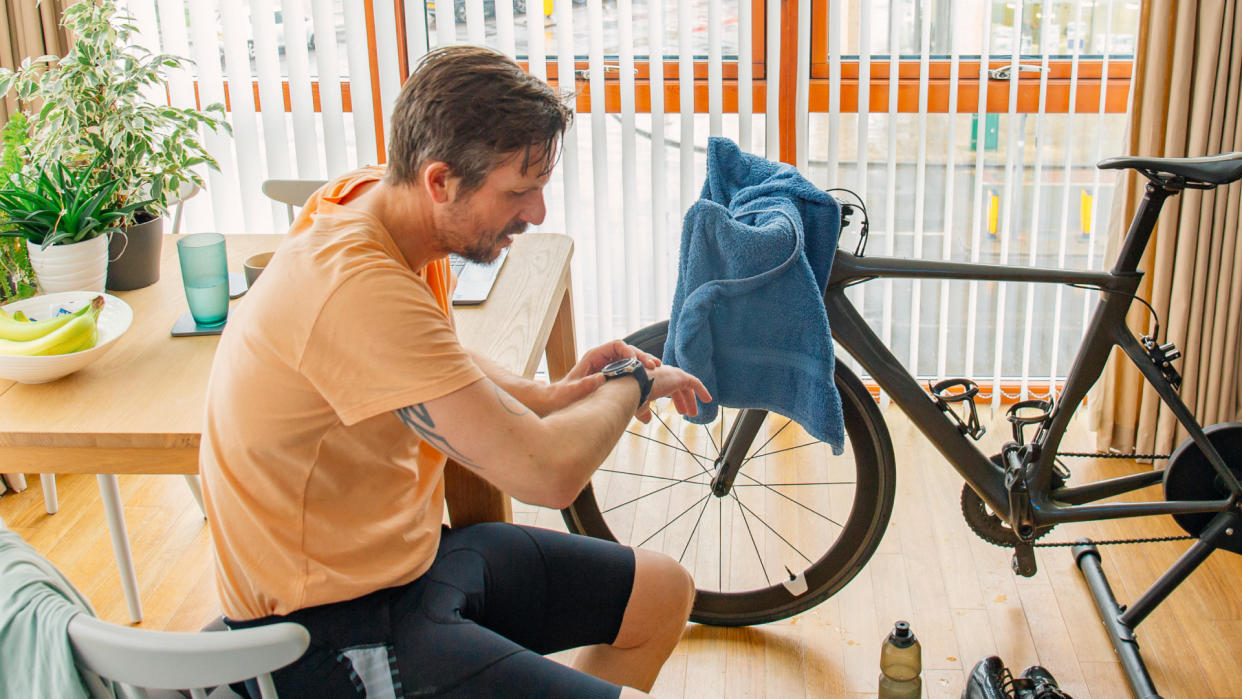
To find out, I used a combination of Garmin’s Fenix 7 smartwatch to track my resting heart rate, heart rate variability and other variables. I also performed a series of fitness tests on the turbo to track what was happening to my power and heart rate numbers.
Then, it was a simple case of allowing a series of bad nights’ sleep and conducting the first tests. I followed that with a series of nights in which I got at least the eight hours of sleep that Garmin recommends, and conducted the final tests after that.
The results were quite interesting - particularly that my heart rate was typically suppressed for any given power when I wasn’t adequately rested. Just glancing at the numbers, it would be quite easy for someone to mistake that for an improvement in fitness - a lower heart rate for a given power can mean that your body has become more efficient and you’ve become fitter.
But a closer look reveals the tell-tale signs that everything is not as rosy as it appears, and that I was carrying some heavy fatigue.
So, without further ado, let’s dive into the numbers and the tests I performed to see just what difference getting a full eight hours made to my riding.
Power tests
First, I needed to choose what power test I was actually going to conduct. A straightforward FTP test on Zwift would be the most obvious, but there are myriad of factors that can affect the outcome of a maximal, all-out test - it would have been too easy for something to end up skewing the results.
With that in mind, I opted for two sub-maximal power tests. These would show the relationship between my power and heart rate numbers without introducing other, more nebulous, variables such as motivation or pacing.
The first was the Lamberts Submaximal Cycling Test (LSCT), and plain and simple two hours of Zone 2 (sub lactate threshold 1) aerobic endurance. Both were conducted with a heart rate monitor and power from a Wahoo Kickr V5 with Wahoo Powrlink Zero pedals to compare.
The LSCT test consists of a six minute effort at 60 per cent maximum heart rate (HRmax), followed by six minutes at 80 per cent HRmax, followed by three minutes at 90 per cent HRmax, and then finally ending with 90 seconds of no pedaling.
To remain consistent, I had a fan for both tests at the same level of airflow, wore the same kit, and did the test on days where temperature and humidity were similar. I had the same breakfast and no caffeine beforehand.
For the first test (sleep deprived), the results were as follows:
· Stage 1. 110BPM - 167W - 79RPM
· Stage 2. 148BPM - 289W - 83RPM
· Stage 3. 165BPM - 342W - 89RPM
· Stage 4. 168BPM down to 99BPM
While the second (adequately rested), these were the results:
· Stage 1. 112BPM -165W - 77RPM
· Stage 2. 149BPM - 293W - 88RPM
· Stage 3. 167BPM - 363W - 96RPM
· Stage 4. 169BPM down to 90BPM
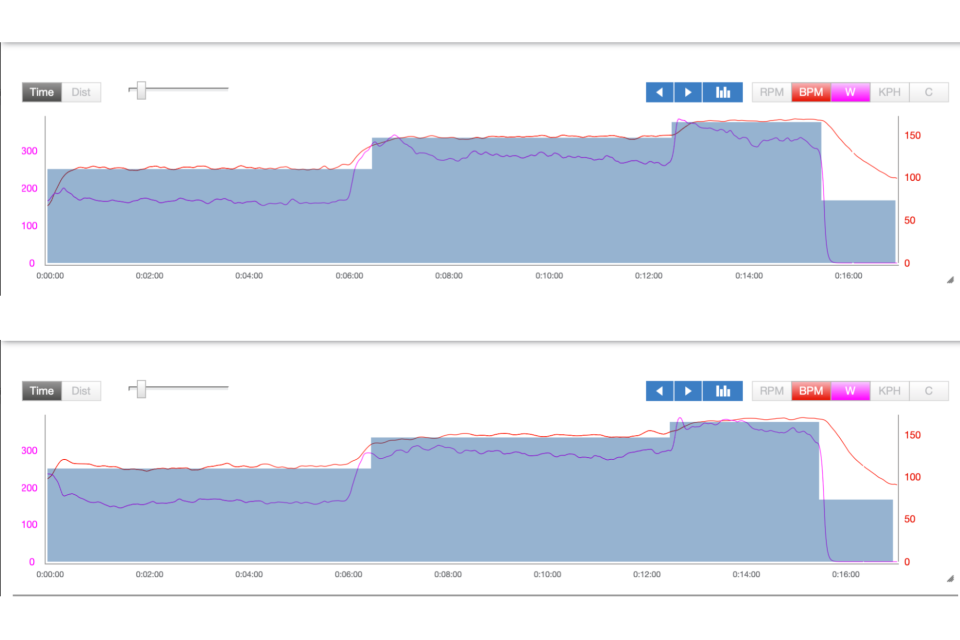
On paper, the results don’t look too different and - if anything - it looks as if my performance when rested was actually worse, with a higher hear rate for similar watts.
But the devil is in the detail, and things start to clear up when you look at my heart rate’s real-time response to the changes in power.
My heart rate responded faster in the second test, as well as not drifting upwards as much - which can be seen by my power remaining more consistent with my heart in stage 2 and 3 in my ‘rested’ test, rather than slowly dropping off as my power does in the sleep deprived test.
My heart rate also recovered faster in the final stage, showing likely better recovery and being in a more recovered state. As an indication of your fitness, you want to see your heart rate being reactive and responsive to changes in power - not simply just low.
The second test was a Zone 2 aerobic ride for two hours. Again conducted on the turbo so as to ensure consistent power output and performed using ERG mode (with a break to ride out of the saddle every 15 minutes). Fuelling, hydration, cadence and caffeine were all controlled.
What I was looking for was firstly the heart rate (HR) for a given power output, followed then by cardiac drift (the rate your heart rate increases during a ride while power remains consistent). I also looked at my peak HR during a 30 second effort in the final 15 minutes of the ride, and my HR recovery after the effort.
The difference between the two tests was actually quite a change. Both were performed at 205 watts (210 normalized power) but my HR was 138 BPM for the first test and 125 for the second - so in this case my heart rate was higher in my sleep deprived state and lower when I was rested, which is what you would expect to see.
Put another way, my Efficiency Factor (EF), which is the amount of normalized watts (external work) for heart rate (internal work), increased from 1.52 up to 1.68. A higher EF indicates a better aerobic system as we are able to put out more power for less internal workload, therefore becoming more efficient. There was also no upward cardiac drift experienced in the rested test (-1.85%) compared to a sizeable amount in the sleep deprived test (5.04%).
The final part of these tests was the 30 second maximum effort. What I was looking for here was a high peak heart rate - to indicate better freshness - and a fast HR recovery to slow good ability to clear metabolites generated by the sprint.
For the sleep deprived test, my HR peaked at 170 BPM and didn’t drop to below 148 in the remaining 15 minutes. For the rested test, my HR peaked at 183 (my HRmax is 185) and recovered to 129 for the remaining 15 minutes.
Garmin stats
Another metric which changed between being sleep deprived and adequate rested was my Resting Heart Rate (RHR). This started at 51 at the beginning of the test with that average dropping down to 46 by the end of the 9 days. My Heart Rate Variability (HRV) remained fairly stable with overnight readings and within a suitable zone for myself. Although little changes, they can be a useful indicator of overall stress and recovery levels.
Outside of tests, training and numbers, another benefit of having better sleep has been day to day energy levels, a reduction in food cravings, and better work productivity.
Some days I did get more than the recommended amount of sleep, and based on these internal perceptions, I know that personally that I go better off between 8 to 9 hours of sleep. This is another important factor to remember that each person will have an ideal amount of sleep that they need.
Fortunately, using one of the best smartwatches for cycling and tracking internal perceptions is a great way of determining how much sleep works best for you. Using both HRV and RHR are ways you can try and track how your rest is affecting you. At the end of the day, if you experience more stress, be that work or training, you require more rest to recover.
So, a non-elevated RHR and a stable HRV within your suitable range are good ways of checking that fatigue is not getting out of hand and can be inferred that you are then getting enough rest.
What did I learn?
What did I learn from tracking my sleep, improving the amount and quality of it, and tracking how it affected my training? Based on the numbers from training sessions, it is certainly clear that aerobic performance and recovery both improved, with fatigue levels having dropped too.
Added to this, in my general perceptions day to day, I felt more productive and energized - it is clear that more sleep had a significant, if not scientifically statistically significant, effect on my performance and well-being. I think it’s a common trend that after a good sleep many of us will feel a lot better, but to see the quantifiable gains in training really is quite impressive. They say rest is best, and sleep is the best rest!

