Why Capstar Financial Holdings, Inc.’s (NASDAQ:CSTR) High P/E Ratio Isn’t Necessarily A Bad Thing

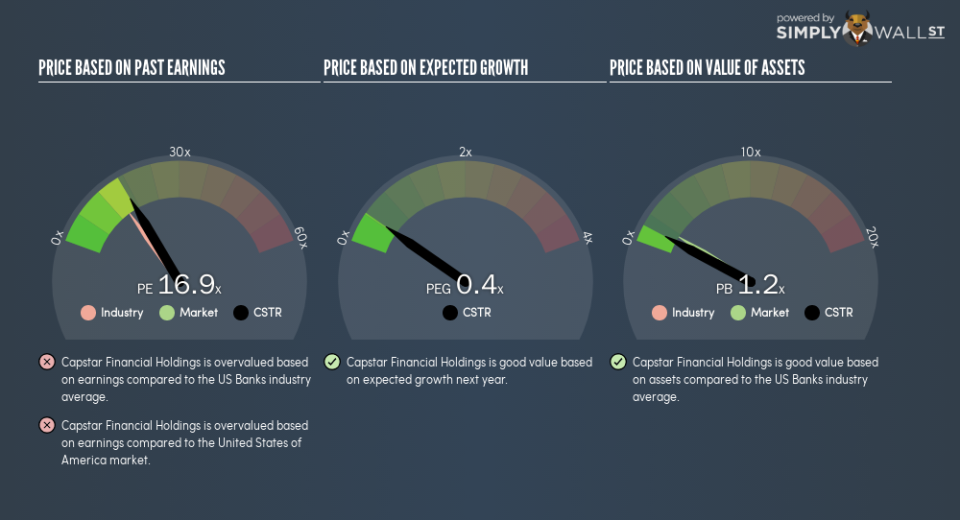
The goal of this article is to teach you how to use price to earnings ratios (P/E ratios). We’ll show how you can use Capstar Financial Holdings, Inc.’s (NASDAQ:CSTR) P/E ratio to inform your assessment of the investment opportunity. Based on the last twelve months, Capstar Financial Holdings’s P/E ratio is 16.9. That means that at current prices, buyers pay $16.9 for every $1 in trailing yearly profits.
See our latest analysis for Capstar Financial Holdings
Want to help shape the future of investing tools and platforms? Take the survey and be part of one of the most advanced studies of stock market investors to date.
How Do I Calculate A Price To Earnings Ratio?
The formula for P/E is:
Price to Earnings Ratio = Share Price ÷ Earnings per Share (EPS)
Or for Capstar Financial Holdings:
P/E of 16.9 = $15.05 ÷ $0.89 (Based on the trailing twelve months to September 2018.)
Is A High P/E Ratio Good?
A higher P/E ratio implies that investors pay a higher price for the earning power of the business. That isn’t a good or a bad thing on its own, but a high P/E means that buyers have a higher opinion of the business’s prospects, relative to stocks with a lower P/E.
How Growth Rates Impact P/E Ratios
When earnings fall, the ‘E’ decreases, over time. Therefore, even if you pay a low multiple of earnings now, that multiple will become higher in the future. Then, a higher P/E might scare off shareholders, pushing the share price down.
Notably, Capstar Financial Holdings grew EPS by a whopping 131% in the last year. But earnings per share are down 6.9% per year over the last five years.
How Does Capstar Financial Holdings’s P/E Ratio Compare To Its Peers?
The P/E ratio indicates whether the market has higher or lower expectations of a company. As you can see below, Capstar Financial Holdings has a higher P/E than the average company (14.6) in the banks industry.
Capstar Financial Holdings’s P/E tells us that market participants think the company will perform better than its industry peers, going forward. Shareholders are clearly optimistic, but the future is always uncertain. So further research is always essential. I often monitor director buying and selling.
Don’t Forget: The P/E Does Not Account For Debt or Bank Deposits
It’s important to note that the P/E ratio considers the market capitalization, not the enterprise value. In other words, it does not consider any debt or cash that the company may have on the balance sheet. In theory, a company can lower its future P/E ratio by using cash or debt to invest in growth.
Such expenditure might be good or bad, in the long term, but the point here is that the balance sheet is not reflected by this ratio.
Is Debt Impacting Capstar Financial Holdings’s P/E?
Capstar Financial Holdings has net debt worth 28% of its market capitalization. This is enough debt that you’d have to make some adjustments before using the P/E ratio to compare it to a company with net cash.
The Bottom Line On Capstar Financial Holdings’s P/E Ratio
Capstar Financial Holdings has a P/E of 16.9. That’s around the same as the average in the US market, which is 16.8. Given it has reasonable debt levels, and grew earnings strongly last year, the P/E indicates the market has doubts this growth can be sustained. Because analysts are predicting more growth in the future, one might have expected to see a higher P/E ratio. You can taker closer look at the fundamentals, here.
When the market is wrong about a stock, it gives savvy investors an opportunity. If the reality for a company is better than it expects, you can make money by buying and holding for the long term. So this free visualization of the analyst consensus on future earnings could help you make the right decision about whether to buy, sell, or hold.
Of course you might be able to find a better stock than Capstar Financial Holdings. So you may wish to see this free collection of other companies that have grown earnings strongly.
To help readers see past the short term volatility of the financial market, we aim to bring you a long-term focused research analysis purely driven by fundamental data. Note that our analysis does not factor in the latest price-sensitive company announcements.
The author is an independent contributor and at the time of publication had no position in the stocks mentioned. For errors that warrant correction please contact the editor at editorial-team@simplywallst.com.
