This uncanny chart shows the Bitcoin bubble could be about to burst
Bitcoin's exponential surge in the latter quarter of 2017 became one of the biggest stories of the year. However, if its current trajectory continues, it could become one of the biggest stories of 2018 for all the wrong reasons.
After starting 2017 at around $900, the cryptocurrency broke the $11,000 barrier a mere 12 hours after hitting $10,000 at the end of November before rising to a peak in excess of $18,000 shortly afterwards.
The number of Google searches for Bitcoin spiked as hype built, with volume for the week ending December 2 double that for the preceding seven-day period. Search interest peaked the week before Christmas.
However, since then it hasn't been plain sailing. A big drop in price in late December was followed by a recovery, but since the start of this year the price has fallen again.
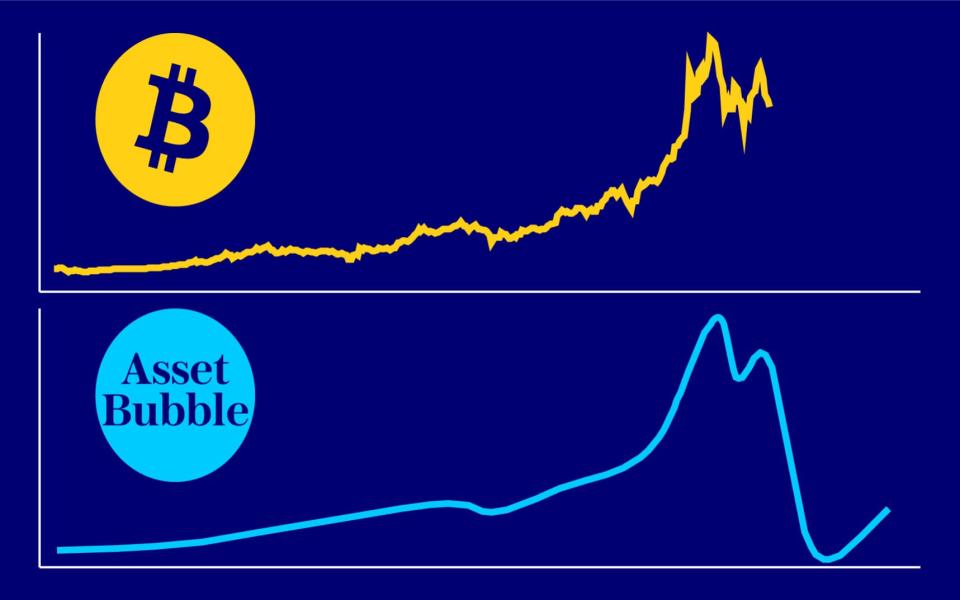
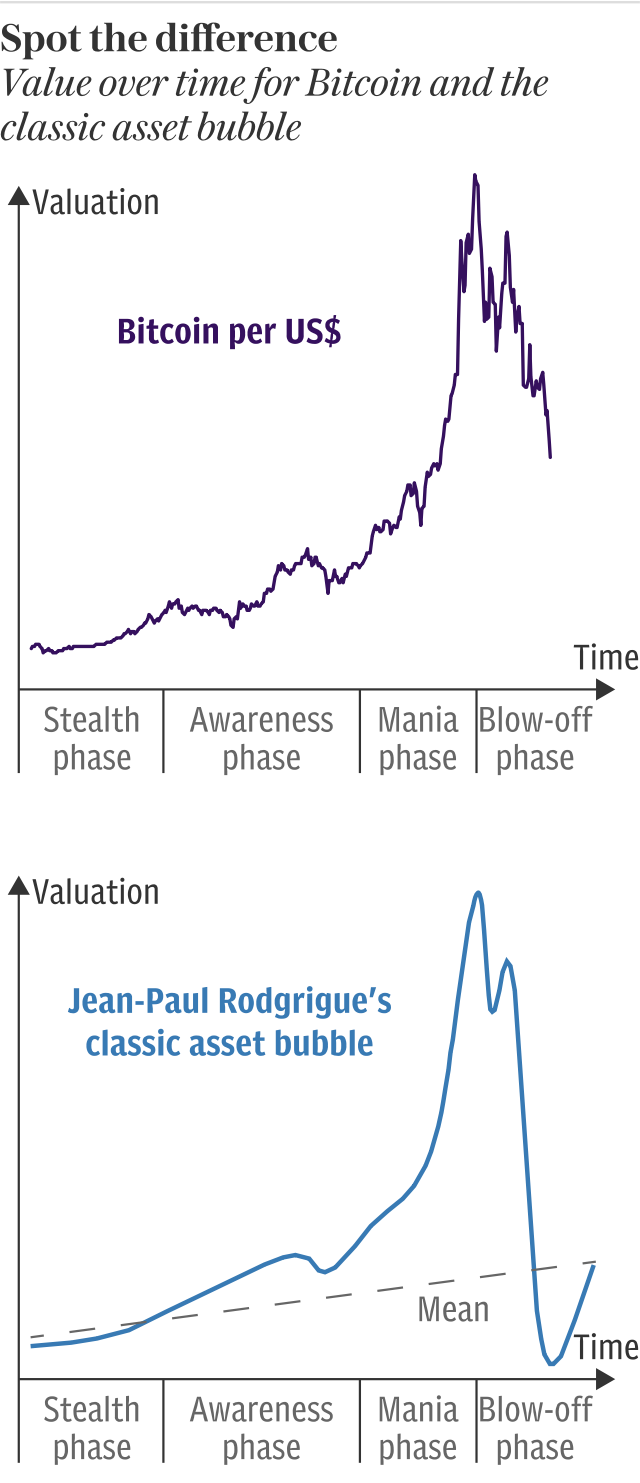
This is a make-or-break time for Bitcoin, the price of which has – so far – followed the trajectory of a classic asset bubble to an eerie degree. If it is a bubble, it is about to burst.
The four phases of an asset bubble
In 2008 Dr Jean-Paul Rodrigue, from the Department of Economics and Geography at Hofstra University in New York, described a four-stage model for the value of an asset during a bubble.
No two bubbles are the same – and the length of the phases will differ from bubble to bubble – but the model is useful in trying to understand what is, or at least could be, going on with Bitcoin.
1. The stealth phase
The first phase – the "stealth" phase – is the point at which early adopters realise that an opportunity for investment is developing.
These investors are keen market watchers but also recognise the significant risk of the proposition in these early days. As such, they invest cautiously and without making too much noise.
In the case of Bitcoin, these early adopters would now have made a significant return on their early investment – provided they didn't lose their log-in.
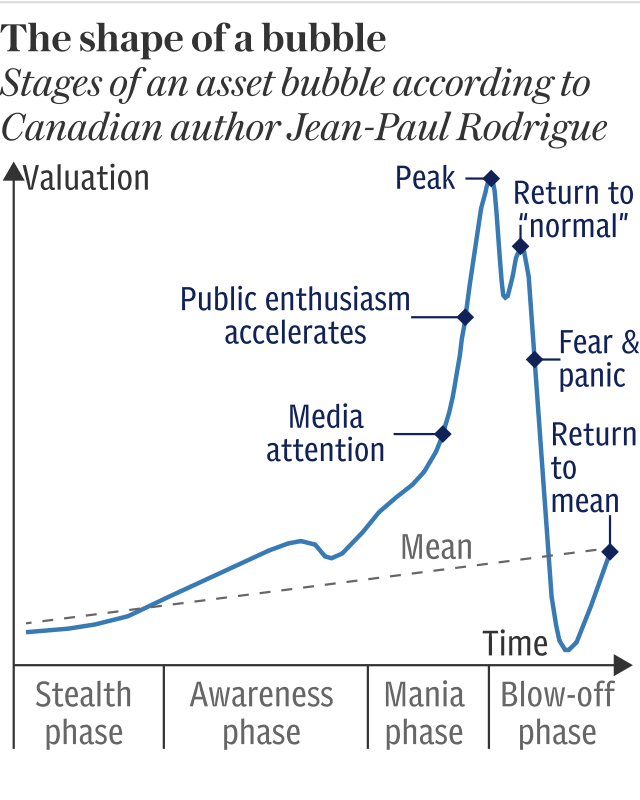
2. The awareness phase
As the proposition becomes more obvious other investors start getting involved, pushing up the value of the asset in question.
During this phase there could well be an early sell-off as those who are new to the party make a quick profit off the back of the increase.
Hype around the asset will start to gain momentum during this period.
3. The mania phase
This is where the bubble really starts expanding.
With word spreading of the investment opportunity, amateur investors start to eye an apparently fail-safe way to make some cash.
The hype starts to fuel itself exponentially as the excitement around the increasing value of the asset pushes up the value of the asset. This feeds the delusion that prices can only increase and profits are guaranteed.
At this point new investors are more like speculators, with very little interest in the asset itself; they are gambling on price increases.
This was evident during the US housing market crash between 2006 and 2009 when purchasing houses just to "flip" them was at its peak.
This is where Bitcoin was at in December 2017.
4. The blow-off phase
This phase is home to a classic Emperor's New Clothes moment that turns the tide from manic buying to panic selling on a large scale.
There is no guaranteed signal for when this will occur but at this point the savvy investors will have already started to cash out, leaving a greater concentration of those who made excitement-fueled purchases still in the game.
When prices falter, those left in play lose confidence very quickly and the value of the asset plummets just as quickly as it rose before regressing back to the mean of where the market was headed before the bubble.
Interestingly, the curve also accounts for the fact that there could be a small recovery in the value of the asset before it begins to plunge to rock bottom, prompting believers to think it will return to "normal".
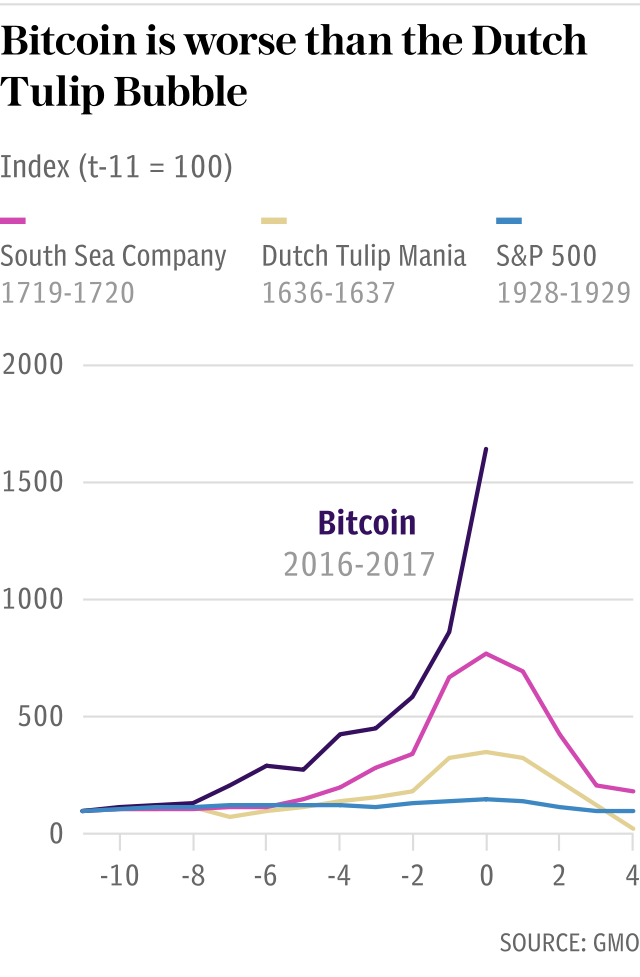
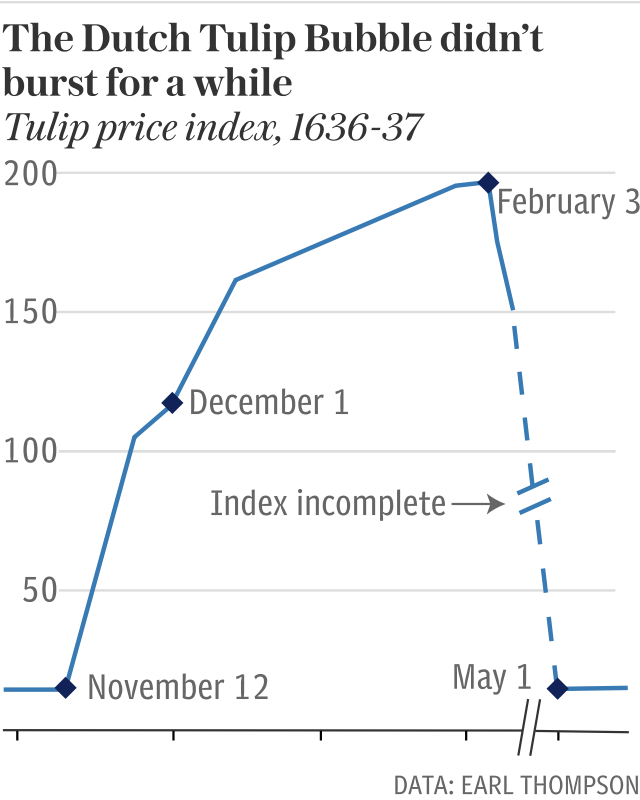
During the famous Dutch Tulip Bubble in the 17th century the price of a bulb rose 20-fold over the course of a few months from November 1636 and February 1637, before plummeting by 99pc by May 1637.
Where does Bitcoin fit in to this model?
Arguments about whether Bitcoin is a bubble or the internet age's answer to the Gold Rush have been bandied backwards and forwards in recent months.
Based on Bitcoin's price relative to the theoretical asset bubble curve, the answer is likely to come soon.
If Bitcoin is a bubble, then we're at the beginning of the blow-off phase when investors will start to panic and the value of the cryptocurrency will plummet.
Given signs that China may be about to clamp down on its Bitcoin mining businesses, it would be a brave person to invest in the cryptocurrency at the present time.
If Bitcoin does manage to hold stable in the coming weeks, however, then it could well be here to stay for the foreseeable future.
