Investing in 360 Capital REIT (ASX:TOT) five years ago would have delivered you a 0.9% gain
In order to justify the effort of selecting individual stocks, it's worth striving to beat the returns from a market index fund. But every investor is virtually certain to have both over-performing and under-performing stocks. So we wouldn't blame long term 360 Capital REIT (ASX:TOT) shareholders for doubting their decision to hold, with the stock down 32% over a half decade.
Now let's have a look at the company's fundamentals, and see if the long term shareholder return has matched the performance of the underlying business.
View our latest analysis for 360 Capital REIT
While markets are a powerful pricing mechanism, share prices reflect investor sentiment, not just underlying business performance. One imperfect but simple way to consider how the market perception of a company has shifted is to compare the change in the earnings per share (EPS) with the share price movement.
While the share price declined over five years, 360 Capital REIT actually managed to increase EPS by an average of 7.7% per year. So it doesn't seem like EPS is a great guide to understanding how the market is valuing the stock. Alternatively, growth expectations may have been unreasonable in the past.
Because of the sharp contrast between the EPS growth rate and the share price growth, we're inclined to look to other metrics to understand the changing market sentiment around the stock.
The most recent dividend was actually lower than it was in the past, so that may have sent the share price lower.
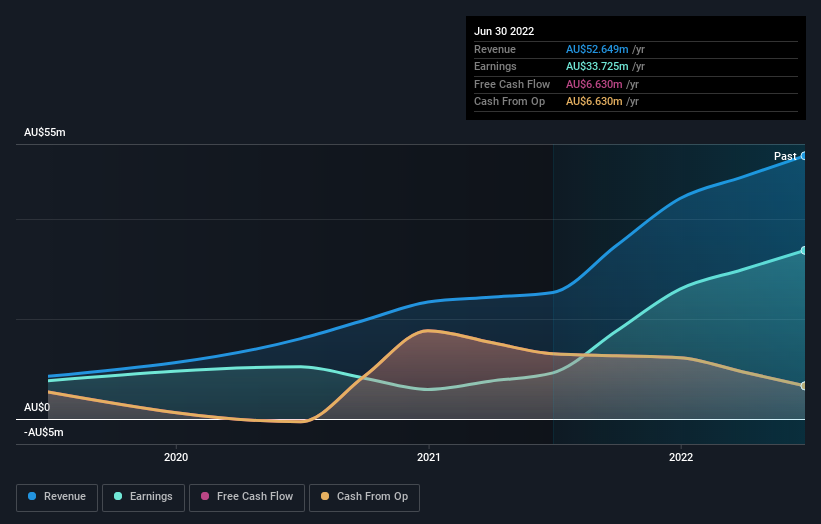
You can see below how earnings and revenue have changed over time (discover the exact values by clicking on the image).
You can see how its balance sheet has strengthened (or weakened) over time in this free interactive graphic.
What About Dividends?
It is important to consider the total shareholder return, as well as the share price return, for any given stock. The TSR is a return calculation that accounts for the value of cash dividends (assuming that any dividend received was reinvested) and the calculated value of any discounted capital raisings and spin-offs. So for companies that pay a generous dividend, the TSR is often a lot higher than the share price return. In the case of 360 Capital REIT, it has a TSR of 0.9% for the last 5 years. That exceeds its share price return that we previously mentioned. The dividends paid by the company have thusly boosted the total shareholder return.
A Different Perspective
While it's certainly disappointing to see that 360 Capital REIT shares lost 3.1% throughout the year, that wasn't as bad as the market loss of 4.7%. Longer term investors wouldn't be so upset, since they would have made 0.2%, each year, over five years. In the best case scenario the last year is just a temporary blip on the journey to a brighter future. It's always interesting to track share price performance over the longer term. But to understand 360 Capital REIT better, we need to consider many other factors. For example, we've discovered 3 warning signs for 360 Capital REIT (1 is significant!) that you should be aware of before investing here.
Of course 360 Capital REIT may not be the best stock to buy. So you may wish to see this free collection of growth stocks.
Please note, the market returns quoted in this article reflect the market weighted average returns of stocks that currently trade on AU exchanges.
Have feedback on this article? Concerned about the content? Get in touch with us directly. Alternatively, email editorial-team (at) simplywallst.com.
This article by Simply Wall St is general in nature. We provide commentary based on historical data and analyst forecasts only using an unbiased methodology and our articles are not intended to be financial advice. It does not constitute a recommendation to buy or sell any stock, and does not take account of your objectives, or your financial situation. We aim to bring you long-term focused analysis driven by fundamental data. Note that our analysis may not factor in the latest price-sensitive company announcements or qualitative material. Simply Wall St has no position in any stocks mentioned.
Join A Paid User Research Session
You’ll receive a US$30 Amazon Gift card for 1 hour of your time while helping us build better investing tools for the individual investors like yourself. Sign up here

