E-mini S&P 500 Index (ES) Futures Technical Analysis – Major Fibonacci Support at 4416.00 Needs to Hold
December E-mini S&P 500 Index futures are trading lower late in the session on Friday, pressured by weakness in major technology shares. Uncertainty is a theme too and when there’s uncertainty investors tend to sell until they get some clarity or prices hit a value area. The big worries for investors at this time are higher corporate taxes and an upcoming Federal Reserve meeting.
At 18:32 GMT, December E-mini S&P 500 Index futures are at 4420.50, down 43.75 or -0.98%.
Daily Swing Chart Technical Analysis
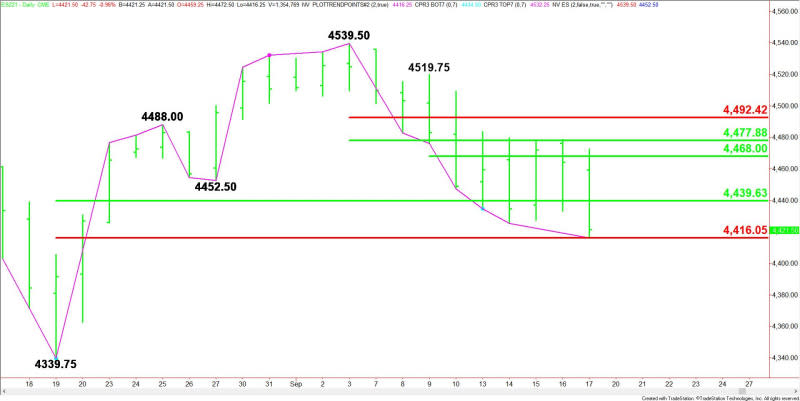
The main trend is down according to the daily swing chart. The next potential downside target is the main bottom at 4339.75.
A trade through 4539.50 will change the main trend to up. This is highly unlikely but since the index is down nine sessions from its last main top on September 3, it is inside the window of time for a potentially bullish closing price reversal bottom.
A closing price reversal bottom won’t change the trend to up, but if confirmed, it could lead to the start of a 2 to 3 day counter-trend rally.
The minor trend is also down. A trade through 4519.75 will change the minor trend to up. This will also shift momentum to the upside.
The main range is 4339.75 to 4539.50. The index is currently testing its retracement zone at 4439.75 to 4416.00.
On the upside, potential resistance levels come in at 4468.00, 4478.00 and 4492.50. This levels will move down as the index move lower through 4416.25.
Daily Swing Chart Technical Forecast
The direction of the December E-mini S&P 500 Index into the close on Friday will be determined by trader reaction to the Fibonacci level at 4416.00.
Bullish Scenario
A sustained move over 4416.00 will indicate the return of buyers. The first upside target is the 50% level at 4439.75. Overtaking this level will indicate the buying is getting stronger with potential upside targets lined up at 4468.00, 4478.00 and 4492.50.
A close over 4464.25 will form a closing price reversal bottom.
Bearish Scenario
A sustained move under 4416.00 will signal the presence of sellers. The daily chart is wide open to the downside under this level so don’t be surprise by a possible acceleration with 4439.75 the next major target.
For a look at all of today’s economic events, check out our economic calendar.
This article was originally posted on FX Empire
More From FXEMPIRE:
Natural Gas Weekly Price Forecast – Natural Gas Forms Massive Exhaustion Candle
GBP/USD Weekly Price Forecast – British Pound Gives Up Early Gains for The Week
Crude Oil Price Update – Trader Reaction to $69.72 Minor Pivot Will Determine Near-Term Direction
S&P 500 Price Forecast – S&P 500 Drifts Towards 50 Day EMA Yet Again
