Could The Market Be Wrong About Serco Group plc (LON:SRP) Given Its Attractive Financial Prospects?
With its stock down 4.2% over the past three months, it is easy to disregard Serco Group (LON:SRP). However, stock prices are usually driven by a company’s financial performance over the long term, which in this case looks quite promising. In this article, we decided to focus on Serco Group's ROE.
Return on equity or ROE is an important factor to be considered by a shareholder because it tells them how effectively their capital is being reinvested. In short, ROE shows the profit each dollar generates with respect to its shareholder investments.
Check out our latest analysis for Serco Group
How Is ROE Calculated?
The formula for ROE is:
Return on Equity = Net Profit (from continuing operations) ÷ Shareholders' Equity
So, based on the above formula, the ROE for Serco Group is:
15% = UK£160m ÷ UK£1.1b (Based on the trailing twelve months to June 2022).
The 'return' refers to a company's earnings over the last year. One way to conceptualize this is that for each £1 of shareholders' capital it has, the company made £0.15 in profit.
What Is The Relationship Between ROE And Earnings Growth?
We have already established that ROE serves as an efficient profit-generating gauge for a company's future earnings. We now need to evaluate how much profit the company reinvests or "retains" for future growth which then gives us an idea about the growth potential of the company. Assuming all else is equal, companies that have both a higher return on equity and higher profit retention are usually the ones that have a higher growth rate when compared to companies that don't have the same features.
Serco Group's Earnings Growth And 15% ROE
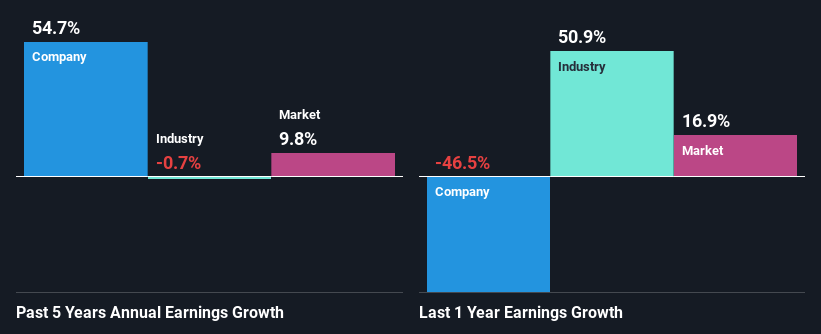
To begin with, Serco Group seems to have a respectable ROE. Especially when compared to the industry average of 7.8% the company's ROE looks pretty impressive. This probably laid the ground for Serco Group's significant 55% net income growth seen over the past five years. However, there could also be other causes behind this growth. Such as - high earnings retention or an efficient management in place.
Next, on comparing with the industry net income growth, we found that the growth figure reported by Serco Group compares quite favourably to the industry average, which shows a decline of 0.7% in the same period.
Earnings growth is a huge factor in stock valuation. It’s important for an investor to know whether the market has priced in the company's expected earnings growth (or decline). By doing so, they will have an idea if the stock is headed into clear blue waters or if swampy waters await. One good indicator of expected earnings growth is the P/E ratio which determines the price the market is willing to pay for a stock based on its earnings prospects. So, you may want to check if Serco Group is trading on a high P/E or a low P/E, relative to its industry.
Is Serco Group Efficiently Re-investing Its Profits?
Serco Group's three-year median payout ratio to shareholders is 12%, which is quite low. This implies that the company is retaining 88% of its profits. So it looks like Serco Group is reinvesting profits heavily to grow its business, which shows in its earnings growth.
Moreover, Serco Group is determined to keep sharing its profits with shareholders which we infer from its long history of paying a dividend for at least ten years. Our latest analyst data shows that the future payout ratio of the company is expected to rise to 29% over the next three years. Despite the higher expected payout ratio, the company's ROE is not expected to change by much.
Summary
Overall, we are quite pleased with Serco Group's performance. In particular, it's great to see that the company is investing heavily into its business and along with a high rate of return, that has resulted in a sizeable growth in its earnings. Having said that, the company's earnings growth is expected to slow down, as forecasted in the current analyst estimates. To know more about the latest analysts predictions for the company, check out this visualization of analyst forecasts for the company.
Have feedback on this article? Concerned about the content? Get in touch with us directly. Alternatively, email editorial-team (at) simplywallst.com.
This article by Simply Wall St is general in nature. We provide commentary based on historical data and analyst forecasts only using an unbiased methodology and our articles are not intended to be financial advice. It does not constitute a recommendation to buy or sell any stock, and does not take account of your objectives, or your financial situation. We aim to bring you long-term focused analysis driven by fundamental data. Note that our analysis may not factor in the latest price-sensitive company announcements or qualitative material. Simply Wall St has no position in any stocks mentioned.
Join A Paid User Research Session
You’ll receive a US$30 Amazon Gift card for 1 hour of your time while helping us build better investing tools for the individual investors like yourself. Sign up here
