BTC On-Chain Analysis: HODL Wave Shows Increased Selling by Medium-Term Holders
A look at on-chain indicators, more specifically the HODL Wave and RHODL ratio in order to determine the age of the coins that are currently being transacted.
The HODL wave shows that coins that were held up to two years are moving, with an increase in selling from the three month to six month band. However, long-term holders are still accumulating.
HODL Wave
The HODL wave shows the time periods in which Bitcoin (BTC) has most recently moved. It does this by using different colors for coins that are being transacted in different time periods.
Red, Orange and Yellow (warm colors) represent recently transacted BTC.
Light Yellow, Green and Blue (colder colors) represent BTC that has not transacted in a while.
Since the beginning of the BTC price decrease in May, there has been less selling (black line) by short-term coins, meaning those that have had their most recent transaction between 24 hours and one month. This either means that short-term holders are not selling, or that the coins which they bought more than a month ago have now matured, and they are capitulating after holding for more than a month.
The increase (green line) in coins that were most recently transacted between one month and two years confirms the second possibility. Short-term holders who bought the April high held their coins for longer than a month, but have recently capitulated.
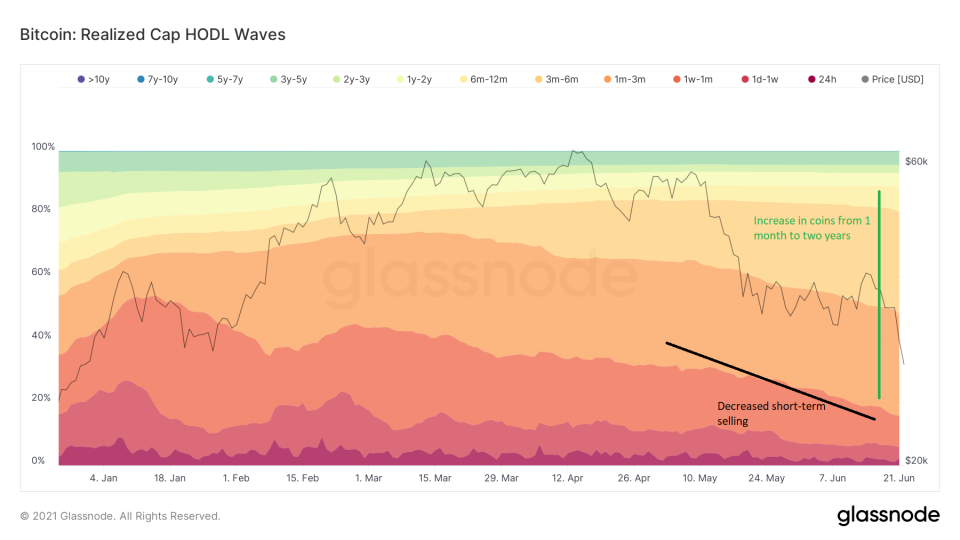
However, the biggest change in spending behavior comes from the three to six month band. Coins that were bought three to six months ago were bought between Jan-22 – March 22 (rectangle). At the time, the BTC price was between $33,000 – $57,000.
Those coins have now matured, and it seems that medium-term holders are now capitulating. While spending from this band was around 7% at the time, it is now at 34%.
There is almost no change in the behavior of long-term holders, since they have yet to sell.

Long-term holders
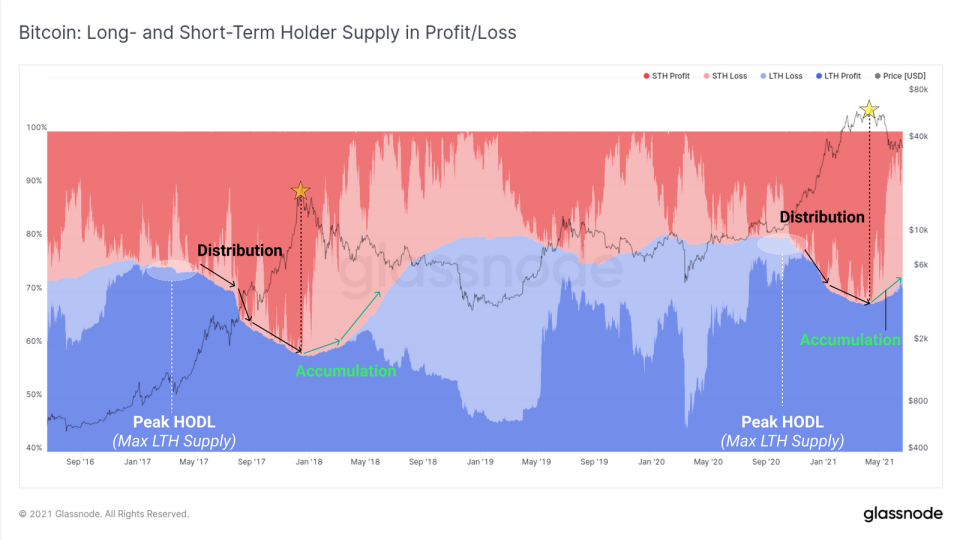
To the contrary, long-term holders are still accumulating. This is evident by the increase in long-term holder supply (blue), even if some holders have started to see unrealized losses.
Short-term holder supply in profit (dark red) is almost nonexistent, while short-term holder supply in loss (light red) is decreasing.
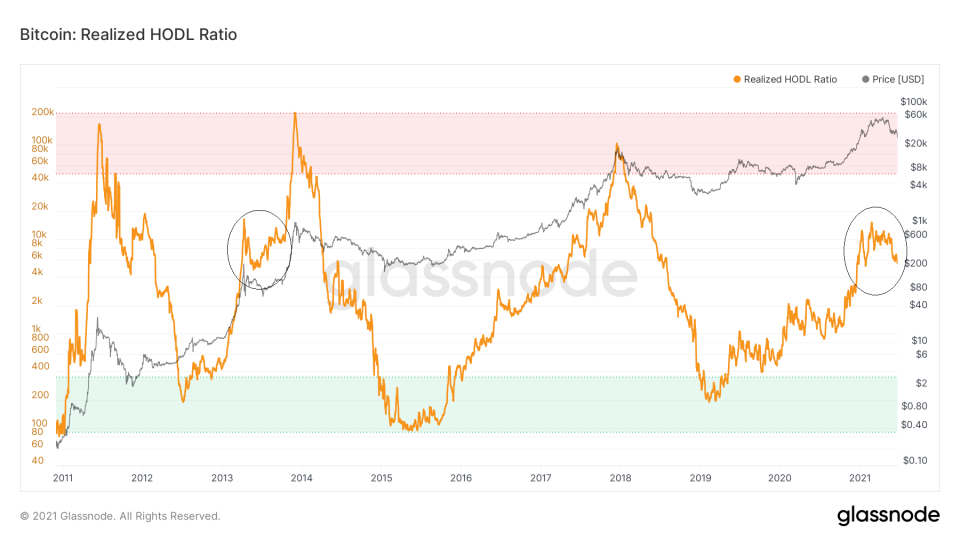
The RHODL Ratio also provides a similar reading. It measures the percentage of short and long-term supply with the ratio of the one week and one-to-two year bands. The current value of 5,550 is more similar to May 2013 (circles) than it is to the absolute top.
This indicates that the current supply held by short-term holders is dissimilar to that which was reached in previous tops.
In all three previous absolute tops, the RHODL ratio has moved above 40,000. This year, it has managed to reach a high of only 12,000.
For BeInCrypto’s latest bitcoin (BTC) analysis, click here.

