Bitcoin Gold DASH and Monero forecast for the week of December 25, 2017, Technical Analysis
Bitcoin Gold
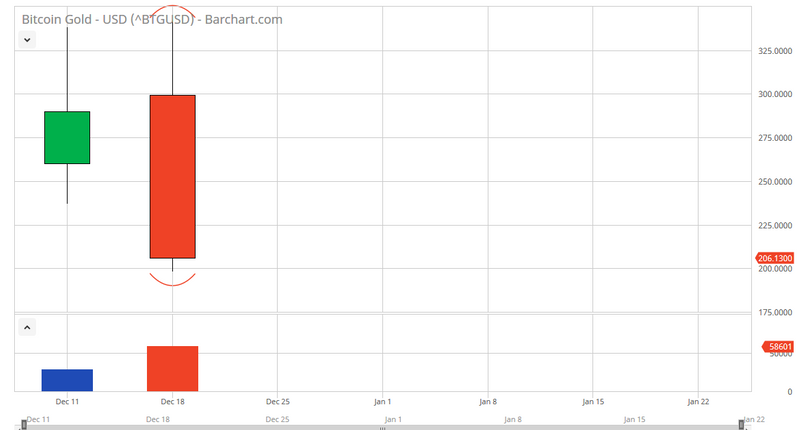
BTG/USD has struggled a bit during the week, initially tried to rally, reaching towards the $350 level. However, we have rolled over rather drastically to form an absolutely engulfing red candle, breaking down below the bottom of the shooting star from the previous week. We have tested $200, and it looks as if we will probably go below there. Longer-term, Bitcoin Gold is probably a short, as crypto currencies or falling out of favor quite rapidly. With this, Bitcoin Gold is probably going to get punished as it isn’t one of the bigger crypto currencies. If the $200 level holds, then we could rally again towards the $300 level, but it isn’t looking as if this is going to happen this week.
BTG/USD DASH USD and XMR USD Video 25.12.17
DASH
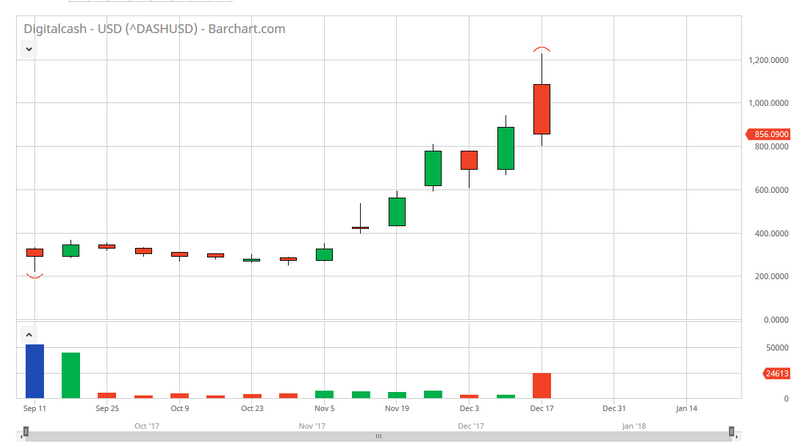
DASH/USD rallied a bit during the trading session, reaching towards the $1200 level initially before falling to the $800 level. One of the most interesting things about this week is not only that it was so brutally negative, but it is the highest volume week going back several months. Because of this, I believe that the selling pressure continues, and a move below the $800 level opens up the market to reach towards $600, and then $400. The markets have been overdone for a while, and I think we are starting to look for more reasonable pricing underneath, as DASH continues to be extraordinarily volatile, even for crypto currency.
Monero
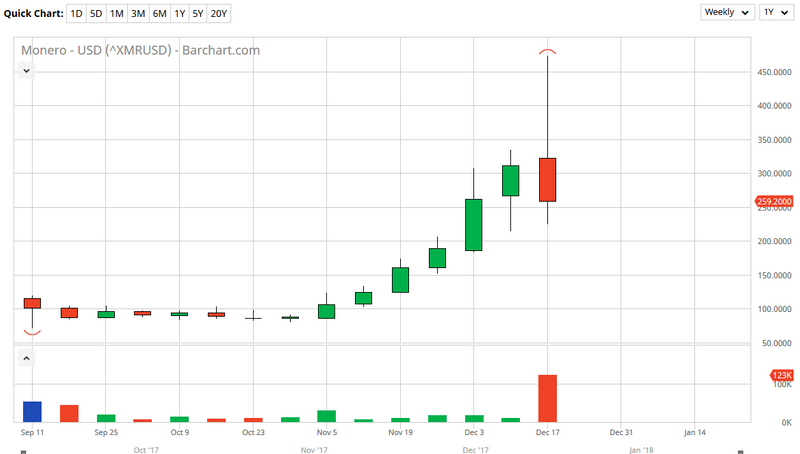
XMR/USD initially shot above the $450 level, but then broke down significantly to form a massive shooting star. At this point, I think that if we break down below the $200 level, the Monero markets are done. That would send the market looking towards the $100 level at the very least, and much like the DASH markets, we’ve seen heavy volume on an extraordinarily negative candle stick. Alternately, if we break above the top of the shooting star, that would be an extraordinarily bullish sign. From a technical analysis standpoint, there’s nothing good about what just happened over the last 5 sessions. Either way, this is going to be very volatile market.
Buy & Sell Cryptocurrency Instantly
This article was originally posted on FX Empire
More From FXEMPIRE:
ETH/USD Price Forecast December 26, 2017, Technical Analysis
Silver forecast for the week of December 25, 2017, Technical Analysis
USD/CAD forecast for the week of December 25, 2017, Technical Analysis
ETH/USD forecast for the week of December 25, 2017, Technical Analysis
Gold forecast for the week of December 25, 2017, Technical Analysis
Dow Jones 30 and NASDAQ 100 forecast for the week of December 25, 2017, Technical Analysis
